Download
1 / 7
70 likes | 214 Vues
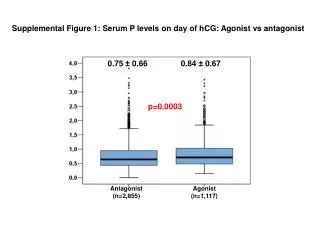
Supplemental Figure 1: Serum P levels on day of hCG: Agonist vs antagonist. 0.75 ± 0.66. 0.84 ± 0.67. p=0.0003. Antagonist (n=2,855). Agonist (n=1,117). Age (years). Supplemental Figure 2. Ongoing pregnancy rate according to age and progesterone levels.

E N D
Supplemental Figure 1: Serum P levels on day of hCG: Agonist vs antagonist 0.75 ± 0.66 0.84 ± 0.67 p=0.0003 Antagonist (n=2,855) Agonist (n=1,117)
Age (years) Supplemental Figure 2. Ongoing pregnancy rate according to age and progesterone levels
Supplemental Figure 3. Ongoing pregnancy rate according to BMI and progesterone levels
Supplemental Figure 4.Ongoing pregnancy rate according to cause of fertility and progesterone levels
Supplemental Figure 5.Ongoing pregnancy rate according to serum E2 levels (pg/mL) on day of hCG and progesterone levels
Supplemental Figure 6.Ongoing pregnancy rate according to total gonadotrophin dose and progesterone levels
Supplemental Figure 7.Serum progesterone levels on day of hCG administration, according to the mean daily FSH dose given