Evapotranspiration
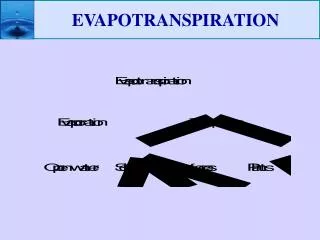
Evapotranspiration. Returning water to the atmosphere. Evapotranspiration (ET). Composed of two subprocesses Evaporation occurs on surfaces of open water or from vegetation and ground surfaces.

Evapotranspiration
E N D
Presentation Transcript
Evapotranspiration Returning water to the atmosphere
Evapotranspiration (ET) • Composed of two subprocesses • Evaporation occurs on surfaces of open water or from vegetation and ground surfaces. • Transpiration is the removal of water from the soil by plant roots, transported through the plant into the leaves and evaporated from the leaf’s stomata. • Typically combined in mass balance equations because the components are difficult to partition. Evapotranspiration Transpiration Evaporation Open Water Plants Vegetation Surfaces Soil
Potential vs. Actual ET • Potential ET (PET) is the amount of evaporation that will occur if an unlimited amount of water is available. • Actual ET (AET) is the actual amount of evaporation that occurs when water is limited. For large areas can use a mass balance approach to calculate (Eq. 4.5).
Some definitions • Saturation vapor pressure (es)is the vapor pressure at which a liquid-vapor system is in a state of equilibrium. It increases exponentially with temperature (Fig. 4.11). • Actual vapor pressure (ed)is the amount of pressure the water vapor in the air exerts on the surface it contacts (Eq. 4.7). • Vapor pressure deficit (es-ed) is the difference between saturation and actual vapor pressures. The book presents three ways to determine the vapor pressure deficit. • Relative humidity is the ratio of the amount of water present in the air to the amount required for saturation of the air at the same dry bump temperature and barometric pressure, expressed as a percentage.
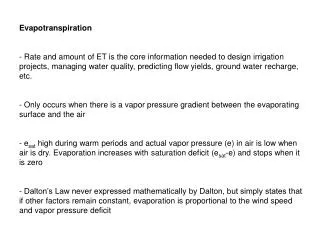
Evaporation • Phase change of water from a liquid to a gas. • Latent heat of vaporization is the energy needed by a molecule to penetrate the water surface (540 cal/g of water evaporated at 100°C. • Rate of evaporation is driven by the vapor pressure deficit. Function of: • The ability of air to hold water based on air temperature and relative humidity. • The energy in the water largely based on temperature. • Net evaporation ceases when the air has reached the saturation vapor pressure. • For evaporation to continue, some mechanism is needed to remove water vapor from the air above the evaporating surface (wind).
Evaporation From Open Water • Gives good estimation of PET rates. • Effected by 4 (minor) factors: • Barometric pressure • Dissolved matter • Shape, site and situation of evaporating body. • Relative depth of evaporating body. • Monthly evaporation from lakes or reservoirs can be calculated using the formula developed by Meyer, based on Dalton’s law. (Eq. 4.17)
Evaporation from bare soil • Similar to open water evaporation when soil is saturated. • Divided into two stages. • Stage 1: Soil is at or near saturation • Evaporation is controlled by heat energy • Approximately 90% of maximum PET • Stage 2: Falling stage • Surface starts to dry and evaporation occurs below the soil surface. • Controlled by soil properties rather than weather conditions.
Evaporation from Vegetative Surfaces • Interception is the water retained on plant surfaces during and after precipitation. • 10 to 25% of annual precipitation is intercepted. • Plant transpiration is reduced by the amount of intercepted water to be evaporated.
Transpiration • Transpiration is the loss of water in the form of vapor from plants • Factors that affect transpiration rates • Type of plant • Wind • Plant Available Water: the portion of water in a soil that can readily be absorbed by plant roots. Amount of water released between field capacity (amount of water remaining in the soil after gravitation flow has stopped) and wilting point (amount of water in the soil at 15 bars of suction).
Transpiration Ratio & consumptive use • Transpiration ratio is the ratio of the weight of water transpired to the dry weight of the plant. • Measure of how efficiently crops use water. • Examples: Alfalfa (900), Wheat (500), Corn (350) • Consumptive Use is the amount of water needed to grow a crop (ET requirement + water stored in plant tissues).
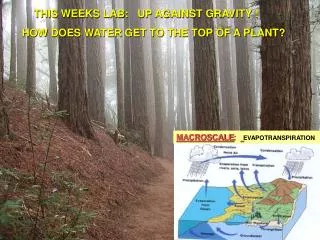
Measuring Evaporation and ET • Several methods • Evaporation Pans • PET Gages-acts as surrogates for plants • Soil Water Depletion • Lysimeters • Energy Balance and Mass transfer-measure average gradient of water vapor above the canopy.
Pan Evaporation • Oldest / simplest method to measure evaporation • Measure water depths in a pan • U.S. Weather Bureau has standard Class A pan • Cylindrical container made of galvanized steel • 10 inches deep and 48 inches in diameter • Pan placed on a 6 inch wooden platform • Site should be flat and free of obstructions • Water filled to 8 inches deep • Refill when water drops to 7 inches deep • Water level measurements made using a hook gage • Measurements to 0.01 inch
Determining Pan factors • Etr=kp Epan • Lake evaporation • Typically taken as 70% of pan evaporation • PET • Pan evaporation times a coefficient ranging from 0.6 to > 1.0.
Pan Evaporation / Example Problem • Given: • Set up below with a class A pan • Average wind speed = 4.3 km/hr to the east • Average relative humidity = 67% • Measured water change in pan on July 1 = 7.5 mm 200 m N Class A Pan 200 m Turfgrass (4 in.)
Pan Evaporation / Example Problem • Required: • Calculate the PET for July 1 • Solution: • Fetch = • Wind speed = • Set up = • Kp = • PET = Kp x depth change = • PET =
Lysimeters • Allow an area to be isolated from the rest of the field while carefully measuring the individual components of the water balance. • Weighing • Non-weighing-measure drainage from the bottom
Estimating ET • SCS Blaney-Criddle Method • Estimates seasonal AET. • Can be used for monthly estimates if monthly crop coefficients are locally available (Table 4.8) • Assumes mean monthly air temperature and annual day time hours can be used as an substitute for solar radiation to estimate the energy received by the crop. • Monthly consumptive factor (f) • Where t is the mean monthly air temperature in °F and p is the mean monthly percentage of annual daytime hours (Table 4.6).
Blaney-Criddle Equation • U is the seasonal consumptive use in in/season • K is the seasonal consumptive use coefficient for a crop with a normal growing season (Table 4.7)
Seasonal consumptive Use Factors • Mean monthly temperatures are available on the web at a variety of places. For example http://cdiac.esd.ornl.gov/r3d/ushcn/statemean.html http://www.weatherbase.com/
PET estimation methods • Simple models require measurement of only 1 weather variable • Temperature methods • Relates PET rates to air temperature • Thornthwaite Method (good only for east-central U.S.) • Requires average monthly air temperature • Latitude which is related to the length of day • Radiation methods • Relates PET rates to solar radiation • Jensen-Haise method
Penman methods • Penman equations • Equations to account for energy required to sustain evaporation • Solar radiation • % sunshine • Humidity • Wind • Long equations with many variables (Eqn. 4.30) • Problems • Complex equation • Need to keep units consistent • Need lots of data as inputs
PET in Texas Daily PET (MM) January Daily PET (MM) August
Daily evaporation in Belgium Daily evapotranspiration (mm/day). June 26, 1996.
Long Term Water Balances • Basic equation for a control volume: • I - O = DS • Inputs – Outputs = Change in Storage • Control volumes in hydrology • Pond, cultivated field, subdivision, watershed, river basin, etc. • Example1: Control volume is a pond • Inputs (I) • precipitation, runoff, water pumped in • Outputs (O) • Discharges, seepage losses, evaporation • Change in Storage (DS) • Change in volume of water stored in pond
Long Term Water Balances • Example 2: Control volume is a vegetated plot • Inputs: precipitation, irrigation • Outputs: evapotranspiration (ET), infiltration, runoff • D S = change in volume of water stored in the soil profile • 2 conditions exist for vegetated plots • If the soil profile is kept very wet ET is maximized. • If the soil profile dries naturally ET is limited by available water in the soil profile
BAEN 460 and AGSM 335 • Homework 3