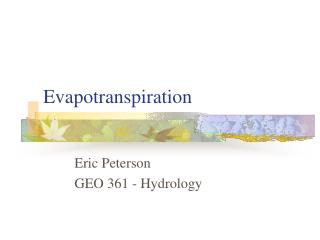
EVAPOTRANSPIRATION
EVAPOTRANSPIRATION. Development of an application to estimate evapotranspiration at regional scale using remote sensing and meteorological data. García Alfredo G. Di Bella Carlos M. Hartmann Tomás. EVAPOTRANSPIRATION. OBJECTIVE OF THE APPLICATION.

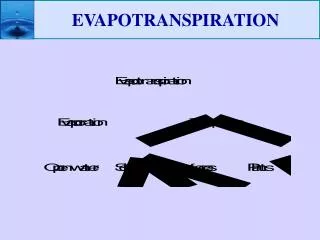
EVAPOTRANSPIRATION
E N D
Presentation Transcript
EVAPOTRANSPIRATION Development of an application to estimate evapotranspiration at regional scale using remote sensing and meteorological data García Alfredo G. Di BellaCarlos M. Hartmann Tomás
EVAPOTRANSPIRATION OBJECTIVE OF THE APPLICATION To develop an application using ILWIS software and GEONETCast Toolbox to estimate evapotranspiration on clear sky conditions, and provide a useful tool in the calculation of water balances at regional scale. STUDY AREA
EVAPOTRANSPIRATION OBJECTIVE OF THE APPLICATION To develop an application using ILWIS software and GEONETCast Toolbox to estimate evapotranspiration on clear sky conditions, and provide a useful tool in the calculation of water balances at regional scale. STUDY AREA Surface: 20000 km2
METHODOLOGY DESCRIPTION OF METHODOLOGY - FLOW CHART ETd=NRd-B(Ts-Ta)n Simplified Method (Jackson et al. 1977) Digital Elevation Model (SRTM) MCD43B3 (Surface Albedo and Emissivities) Total incoming short wave radiation (Kumar et al. 1997) Albedo (Liang 2000) Net short wave radiation (Sn) Net long wave radiation (Ln) Net Radiation (MJ/m2d)-2010/001-016 Daily Net Radiation (NRd)
METHODOLOGY DESCRIPTION OF METHODOLOGY - FLOW CHART ETd=NRd-B(Ts-Ta)n Simplified Method (Jackson et al. 1977) MOD13A2 (Vegetation Indices) NDVI Scaled NDVI (NDVI*) n-2010/001-016 B-2010/001-016 B and n
METHODOLOGY DESCRIPTION OF METHODOLOGY ETd=NRd-B(Ts-Ta)n Simplified Method (Jackson et al. 1977) MOD07 (Atmospheric Profile) MOD11A2 (Land Surface Temperature and Emissivity) Air Temperature (Ts) Surface Temperature (Ts) Surface Temperature – 2010/001-016 Air Temperature – 2010/001-016
RESULTS ETd=NRd-B(Ts-Ta)n Simplified Method (Jackson et al. 1977) Mean daily ET (mm/d)-2010/001-016 Max ET= 7.4 mm/d Mean = 4.63 mm/d
RESULTS PROBLEMS WITH ILWIS BATCH ROUTINES Mosaic, reproject and subset MODIS images ILWIS Script routine to process the images once per time
RESULTS DATA ANALYSIS LSA-SAF ET Product vs Meteorological Data ET Product vs Meteorological Data