Download

1 / 76
850 likes | 2.37k Vues
Basics of X-Ray Diffraction Self-User Training for the X-Ray Diffraction SEF. Scott A Speakman, Ph.D. 13-4009A speakman@mit.edu (617) 253-6887 http://prism.mit.edu/xray. Additional Training. All users must complete the EHS X-ray Safety training

E N D
Basics of X-Ray DiffractionSelf-User Training for the X-Ray Diffraction SEF Scott A Speakman, Ph.D. 13-4009A speakman@mit.edu (617) 253-6887 http://prism.mit.edu/xray
Additional Training • All users must complete the EHS X-ray Safety training • the next class is Nov 20 from 1:30 to 2:30 pm in N52-496A • The following class is Dec 11 from 1:30 to 2:30 pm • register at http://web.mit.edu/sapwebss/PS1/training_home.shtml • Thursday, Nov 6 in room 13-4027 • next session, Friday Dec 12 • Lab Specific Safety Training, 1 pm to 2 pm • Data Collection with the Rigaku Powder Diffractometer; 2 to 5 pm • Thursday, Nov 13 in room 13-4027 • next session, Wed Dec 17 • Lab Specific Safety Training, 1 pm to 2 pm • High-Speed Data Collection with the PANalytical X’Pert Pro; 2 to 5 pm
Data Analysis Classes • XRD Data Analysis with Jade Workshop • Friday, Nov 7, 1-4 pm, in 13-4041 • Friday, Nov 14, 1-4 pm, in 13-4041 • Tuesday, Dec 2, 1:30-4:30 pm in 13-4041 • Additional Topics • HRXRD and XRR Analysis on Thin Films • Wed, Nov 5 from 1-5 pm in 13-4027 • Wed, Dec 3 from 1 to 5 pm • HRXRD Data Analysis, Nov 14 9:30 am to noon in 13-4041 • Pole Figure Analysis of Texture • Tuesday, Nov 25 from 1-5 pm in 13-4027
Crystalline materials are characterized by the orderly periodic arrangements of atoms. The (200) planes of atoms in NaCl The (220) planes of atoms in NaCl • The unit cell is the basic repeating unit that defines a crystal. • Parallel planes of atoms intersecting the unit cell are used to define directions and distances in the crystal. • These crystallographic planes are identified by Miller indices.
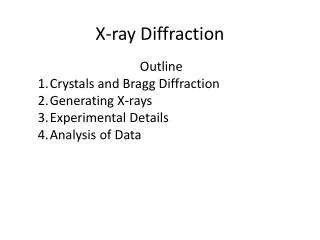
The atoms in a crystal are a periodic array of coherent scatterers and thus can diffract light. • Diffraction occurs when each object in a periodic array scatters radiation coherently, producing concerted constructive interference at specific angles. • The electrons in an atom coherently scatter light. • The electrons interact with the oscillating electric field of the light wave. • Atoms in a crystal form a periodic array of coherent scatterers. • The wavelength of X rays are similar to the distance between atoms. • Diffraction from different planes of atoms produces a diffraction pattern, which contains information about the atomic arrangement within the crystal • X Rays are also reflected, scattered incoherently, absorbed, refracted, and transmitted when they interact with matter.
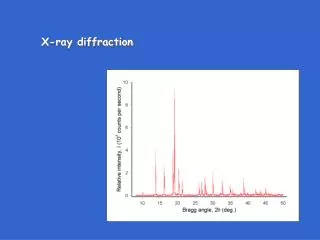
X-Ray Powder Diffraction (XRPD) uses information about the position, intensity, width, and shape of diffraction peaks in a pattern from a polycrystalline sample. The x-axis, 2theta, corresponds to the angular position of the detector that rotates around the sample.
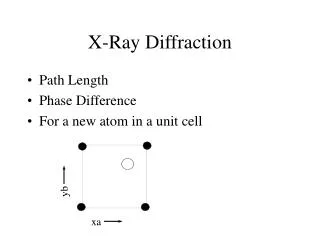
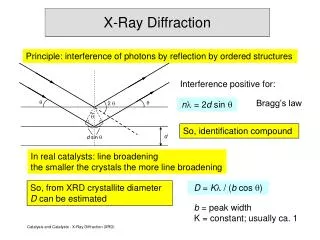
q q dhkl dhkl Bragg’s law is a simplistic model to understand what conditions are required for diffraction. • For parallel planes of atoms, with a space dhkl between the planes, constructive interference only occurs when Bragg’s law is satisfied. • In our diffractometers, the X-ray wavelength l is fixed. • Consequently, a family of planes produces a diffraction peak only at a specific angle q. • Additionally, the plane normal must be parallel to the diffraction vector • Plane normal: the direction perpendicular to a plane of atoms • Diffraction vector: the vector that bisects the angle between the incident and diffracted beam • The space between diffracting planes of atoms determines peak positions. • The peak intensity is determined by what atoms are in the diffracting plane.
Our powder diffractometers typically use the Bragg-Brentano geometry. • The incident angle, w, is defined between the X-ray source and the sample. • The diffracted angle, 2q, is defined between the incident beam and the detector angle. • The incident angle w is always ½ of the detector angle 2q . • In a q:2q instrument (e.g. Rigaku RU300), the tube is fixed, the sample rotates at q°/min and the detector rotates at 2q°/min. • In a q:q instrument (e.g. PANalytical X’Pert Pro), the sample is fixed and the tube rotates at a rate -q°/min and the detector rotates at a rate of q°/min. Detector X-ray tube w q 2q
A single crystal specimen in a Bragg-Brentano diffractometer would produce only one family of peaks in the diffraction pattern. 2q The (110) planes would diffract at 29.3 °2q; however, they are not properly aligned to produce a diffraction peak (the perpendicular to those planes does not bisect the incident and diffracted beams). Only background is observed. The (200) planes are parallel to the (100) planes. Therefore, they also diffract for this crystal. Since d200 is ½ d100, they appear at 42 °2q. At 20.6 °2q, Bragg’s law fulfilled for the (100) planes, producing a diffraction peak.
A polycrystalline sample should contain thousands of crystallites. Therefore, all possible diffraction peaks should be observed. 2q 2q 2q • For every set of planes, there will be a small percentage of crystallites that are properly oriented to diffract (the plane perpendicular bisects the incident and diffracted beams). • Basic assumptions of powder diffraction are that for every set of planes there is an equal number of crystallites that will diffract and that there is a statistically relevant number of crystallites, not just one or two.
Powder Diffraction is more aptly named polycrystalline diffraction • Samples can be powder, sintered pellets, coatings on substrates, engine blocks, … • If the crystallites are randomly oriented, and there are enough of them, then they will produce a continuous Debye cone. • In a linear diffraction pattern, the detector scans through an arc that intersects each Debye cone at a single point; thus giving the appearance of a discrete diffraction peak.
Area (2D) Diffraction allows us to image complete or incomplete (spotty) Debye diffraction rings Polycrystalline thin film on a single crystal substrate Mixture of fine and coarse grains in a metallic alloy Conventional linear diffraction patterns would miss information about single crystal or coarse grained materials
Linear (1D) Diffraction Scans have better resolution and less noise
Diffraction patterns are best reported using dhkl and relative intensity rather than 2q and absolute intensity. • The peak position as 2q depends on instrumental characteristics such as wavelength. • The peak position as dhkl is an intrinsic, instrument-independent, material property. • Bragg’s Law is used to convert observed 2q positions to dhkl. • The absolute intensity, i.e. the number of X rays observed in a given peak, can vary due to instrumental and experimental parameters. • The relative intensities of the diffraction peaks should be instrument independent. • To calculate relative intensity, divide the absolute intensity of every peak by the absolute intensity of the most intense peak, and then convert to a percentage. The most intense peak of a phase is therefore always called the “100% peak”. • Peak areas are much more reliable than peak heights as a measure of intensity.
Powder diffraction data consists of a record of photon intensity versus detector angle 2q. • Diffraction data can be reduced to a list of peak positions and intensities • Each dhkl corresponds to a family of atomic planes {hkl} • individual planes cannot be resolved- this is a limitation of powder diffraction versus single crystal diffraction Raw Data Reduced dI list
You can use XRD to determine • Phase Composition of a Sample • Quantitative Phase Analysis: determine the relative amounts of phases in a mixture by referencing the relative peak intensities • Unit cell lattice parameters and Bravais lattice symmetry • Index peak positions • Lattice parameters can vary as a function of, and therefore give you information about, alloying, doping, solid solutions, strains, etc. • Residual Strain (macrostrain) • Crystal Structure • By Rietveld refinement of the entire diffraction pattern • Epitaxy/Texture/Orientation • Crystallite Size and Microstrain • Indicated by peak broadening • Other defects (stacking faults, etc.) can be measured by analysis of peak shapes and peak width • We have in-situ capabilities, too (evaluate all properties above as a function of time, temperature, and gas environment)
Phase Identification • The diffraction pattern for every phase is as unique as your fingerprint • Phases with the same chemical composition can have drastically different diffraction patterns. • Use the position and relative intensity of a series of peaks to match experimental data to the reference patterns in the database
Databases such as the Powder Diffraction File (PDF) contain dI lists for thousands of crystalline phases. • The PDF contains over 200,000 diffraction patterns. • Modern computer programs can help you determine what phases are present in your sample by quickly comparing your diffraction data to all of the patterns in the database. • The PDF card for an entry contains a lot of useful information, including literature references.
Quantitative Phase Analysis • With high quality data, you can determine how much of each phase is present • must meet the constant volume assumption (see later slides) • The ratio of peak intensities varies linearly as a function of weight fractions for any two phases in a mixture • need to know the constant of proportionality • RIR method is fast and gives semi-quantitative results • Whole pattern fitting/Rietveld refinement is a more accurate but more complicated analysis
Unit Cell Lattice Parameter Refinement • By accurately measuring peak positions over a long range of 2theta, you can determine the unit cell lattice parameters of the phases in your sample • alloying, substitutional doping, temperature and pressure, etc can create changes in lattice parameters that you may want to quantify • use many peaks over a long range of 2theta so that you can identify and correct for systematic errors such as specimen displacement and zero shift • measure peak positions with a peak search algorithm or profile fitting • profile fitting is more accurate but more time consuming • then numerically refine the lattice parameters
00-043-1002> Cerianite- - CeO 2 Intensity (a.u.) 23 24 25 26 27 28 29 30 31 32 33 34 35 36 37 38 39 40 41 2 q (deg.) Crystallite Size and Microstrain • Crystallites smaller than ~120nm create broadening of diffraction peaks • this peak broadening can be used to quantify the average crystallite size of nanoparticles using the Scherrer equation • must know the contribution of peak width from the instrument by using a calibration curve • microstrain may also create peak broadening • analyzing the peak widths over a long range of 2theta using a Williamson-Hull plot can let you separate microstrain and crystallite size
(111) 00-004-0784> Gold - Au 10.0 8.0 (311) (200) 6.0 Intensity(Counts) (220) 4.0 (222) 2.0 (400) 3 x10 40 50 60 70 80 90 100 Two-Theta (deg) Preferred Orientation (texture) • Preferred orientation of crystallites can create a systematic variation in diffraction peak intensities • can qualitatively analyze using a 1D diffraction pattern • a pole figure maps the intensity of a single peak as a function of tilt and rotation of the sample • this can be used to quantify the texture
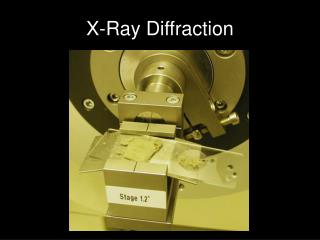
Essential Parts of the Diffractometer • X-ray Tube: the source of X Rays • Incident-beam optics: condition the X-ray beam before it hits the sample • The goniometer: the platform that holds and moves the sample, optics, detector, and/or tube • The sample & sample holder • Receiving-side optics: condition the X-ray beam after it has encountered the sample • Detector: count the number of X Rays scattered by the sample
Most of our powder diffractometers use the Bragg-Brentano parafocusing geometry. • A point detector and sample are moved so that the detector is always at 2q and the sample surface is always at q to the incident X-ray beam. • In the parafocusing arrangement, the incident- and diffracted-beam slits move on a circle that is centered on the sample. Divergent X rays from the source hit the sample at different points on its surface. During the diffraction process the X rays are refocused at the detector slit. • This arrangement provides the best combination of intensity, peak shape, and angular resolution for the widest number of samples. F: the X-ray source DS: the incident-beam divergence-limiting slit SS: the Soller slit assembly S: the sample RS: the diffracted-beam receiving slit C: the monochromator crystal AS: the anti-scatter slit
X-radiation for diffraction measurements is produced by a sealed tube or rotating anode. • Sealed X-ray tubes tend to operate at 1.8 to 3 kW. • Rotating anode X-ray tubes produce much more flux because they operate at 9 to 18 kW. • A rotating anode spins the anode at 6000 rpm, helping to distribute heat over a larger area and therefore allowing the tube to be run at higher power without melting the target. • Both sources generate X rays by striking the anode target wth an electron beam from a tungsten filament. • The target must be water cooled. • The target and filament must be contained in a vacuum.
The wavelength of X rays is determined by the anode of the X-ray source. • Electrons from the filament strike the target anode, producing characteristic radiation via the photoelectric effect. • The anode material determines the wavelengths of characteristic radiation. • While we would prefer a monochromatic source, the X-ray beam actually consists of several characteristic wavelengths of X rays. K L M
Spectral Contamination in Diffraction Patterns Ka1 Ka1 • The Ka1 & Ka2 doublet will almost always be present • Very expensive optics can remove the Ka2 line • Ka1 & Ka2 overlap heavily at low angles and are more separated at high angles • W lines form as the tube ages: the W filament contaminates the target anode and becomes a new X-ray source • W and Kb lines can be removed with optics Ka2 Ka1 Ka2 Ka2 W La1 Kb
Wavelengths for X-Radiation are Sometimes Updated • Often quoted values from Cullity (1956) and Bearden, Rev. Mod. Phys. 39 (1967) are incorrect. • Values from Bearden (1967) are reprinted in international Tables for X-Ray Crystallography and most XRD textbooks. • Most recent values are from Hölzer et al. Phys. Rev. A56 (1997) • Has your XRD analysis software been updated?
The X-ray Shutter is the most important safety device on a diffractometer • X-rays exit the tube through X-ray transparent Be windows. • X-Ray safety shutters contain the beam so that you may work in the diffractometer without being exposed to the X-rays. • Being aware of the status of the shutters is the most important factor in working safely with X rays.
The X-ray beam produced by the X-ray tube is divergent. Incident-beam optics are used to limit this divergence • X Rays from an X-ray tube are: • divergent • contain multiple characteristic wavelengths as well as Bremmsstrahlung radiation • neither of these conditions suit our ability to use X rays for analysis • the divergence means that instead of a single incident angle q, the sample is actually illuminated by photons with a range of incident angles. • the spectral contamination means that the smaple does not diffract a single wavelength of radiation, but rather several wavelengths of radiation. • Consequently, a single set of crystallographic planes will produce several diffraction peaks instead of one diffraction peak. • Optics are used to: • limit divergence of the X-ray beam • refocus X rays into parallel paths • remove unwanted wavelengths
Divergence slits are used to limit the divergence of the incident X-ray beam. • The slits block X-rays that have too great a divergence. • The size of the divergence slit influences peak intensity and peak shapes. • Narrow divergence slits: • reduce the intensity of the X-ray beam • reduce the length of the X-ray beam hitting the sample • produce sharper peaks • the instrumental resolution is improved so that closely spaced peaks can be resolved.
One by-product of the beam divergence is that the length of the beam illuminating the sample becomes smaller as the incident angle becomes larger. • The length of the incident beam is determined by the divergence slit, goniometer radius, and incident angle. • This should be considered when choosing a divergence slits size: • if the divergence slit is too large, the beam may be significantly longer than your sample at low angles • if the slit is too small, you may not get enough intensity from your sample at higher angles • Appendix A in the SOP contains a guide to help you choose a slit size. • The width of the beam is constant: 12mm for the Rigaku RU300.
Other optics: • limit divergence of the X-ray beam • Divergence limiting slits • Parallel plate collimators • Soller slits • refocus X rays into parallel paths • “parallel-beam optics” • parabolic mirrors and capillary lenses • focusing mirrors and lenses • remove unwanted wavelengths • monochromators • Kb filters Parallel Plate Collimator & Soller Slits block divergent X-rays, but do not restrict beam size like a divergent slit Göbel Mirrors and capillary lenses collect a large portion of the divergent beam and refocus it into a nearly parallel beam
Monochromators remove unwanted wavelengths of radiation from the incident or diffracted X-ray beam. • Diffraction from a crystal monochromator can be used to select one wavelength of radiation and provide energy discrimination. • An incident-beam monochromator might be used to select only Ka1 radiation for the tube source. • A diffracted-beam monochromator, such as on the Rigaku RU300, may be used to remove fluoresced photons, Kb, or W-contimination photons from reaching the detector. • Without the RSM slit, the monochromator removes ~75% of unwanted wavelengths of radiation. • When the RSM slit is used, over 99% of the unwanted wavelengths of radiation can be removed from the beam.
Detectors • point detectors • observe one point of space at a time • slow, but compatible with most/all optics • scintillation and gas proportional detectors count all photons, within an energy window, that hit them • Si(Li) detectors can electronically analyze or filter wavelengths • position sensitive detectors • linear PSDs observe all photons scattered along a line from 2 to 10° long • 2D area detectors observe all photons scattered along a conic section • gas proportional (gas on wire; microgap anodes) • limited resolution, issues with deadtime and saturation • CCD • limited in size, expensive • solid state real-time multiple semiconductor strips • high speed with high resolution, robust
Choosing which side of the Rigaku RU300 to use • The Rigaku instrument has two powder diffractometers: • the left-hand side goniometer has a 250mm radius, which provides high angular resolution and more accurate peak positions, but which requires 2 to 3 times longer to collect data because the beam is weaker. • the right-hand side goniometer has a 185mm radius, which provides more intensity and faster data collection, but at the sacrifice of some resolution and accuracy.
Left-Hand Side (250mm radius) of the Rigaku Diffractometer RSM DS=Divergence Slit SS=Scatter Slit RS= Receiving Slit RSM= Monochromator Receiving Slit
Configuring the Rigaku RU300 • To use either Rigaku diffractometer, you will need to choose which divergence slit (DS), anti-scatter slit (SS), receiving slit (RS), and monochromator receiving slit (RSM) to use. • typical DS is ½° or 1° • The slit can be as small as 0.15° or as large as 4° • when low angle data is important or better angular resolution is required (so that peaks near each other can be resolved), use a smaller slit • when high angle data or intensity is more important, use a larger slit • The anti-scatter slit should be the same size as the DS. • the receiving slit is typically 0.3 mm. • larger 0.6mm or smaller 0.15mm slits are also available • a smaller slit provides better peak shapes and resolution, but at the sacrifice of some intensity • The RSM slit is only needed when spectral contamination from K-beta of W-lines is problematic. • should always be used when using the left-hand side, 250mm goniometer. • should always be used when looking at a coating on a single crystal substrate • otherwise, only needed if the sample produces some very strong peaks
Preparing a powder specimen • An ideal powder sample should have many crystallites in random orientations • the distribution of orientations should be smooth and equally distributed amongst all orientations • If the crystallites in a sample are very large, there will not be a smooth distribution of crystal orientations. You will not get a powder average diffraction pattern. • crystallites should be <10mm in size to get good powder statistics • Large crystallite sizes and non-random crystallite orientations both lead to peak intensity variation • the measured diffraction pattern will not agree with that expected from an ideal powder • the measured diffraction pattern will not agree with reference patterns in the Powder Diffraction File (PDF) database
Preferred orientation • If the crystallites in a powder sample have plate or needle like shapes it can be very difficult to get them to adopt random orientations • top-loading, where you press the powder into a holder, can cause problems with preferred orientation • in samples such as metal sheets or wires there is almost always preferred orientation due to the manufacturing process • for samples with systematic orientation, XRD can be used to quantify the texture in the specimen
Important characteristics of samples for XRPD • a flat plate sample for XRPD should have a smooth flat surface • if the surface is not smooth and flat, X-ray absorption may reduce the intensity of low angle peaks • parallel-beam optics can be used to analyze samples with odd shapes or rought surfaces • Densely packed • Randomly oriented grains/crystallites • Grain size less than 10 microns • ‘Infinitely’ thick
Varying Irradiated area of the sample • the area of your sample that is illuminated by the X-ray beam varies as a function of: • incident angle of X rays • divergence angle of the X rays • at low angles, the beam might be wider than your sample • “beam spill-off”
The constant volume assumption • In a polycrystalline sample of ‘infinite’ thickness, the change in the irradiated area as the incident angle varies is compensated for by the change in the penetration depth • These two factors result in a constant irradiated volume • (as area decreases, depth increase; and vice versa) • This assumption is important for many aspects of XRPD • Matching intensities to those in the PDF reference database • Crystal structure refinements • Quantitative phase analysis • This assumption is not necessarily valid for thin films or small quantities of sample on a ZBH
Ways to prepare a powder sample • Top-loading a bulk powder into a well • deposit powder in a shallow well of a sample holder. Use a slightly rough flat surface to press down on the powder, packing it into the well. • using a slightly rough surface to pack the powder can help minimize preferred orientation • mixing the sample with a filler such as flour or glass powder may also help minimize preferred orientation • powder may need to be mixed with a binder to prevent it from falling out of the sample holder • alternatively, the well of the sample holder can be coated with a thin layer of vaseline
Dispersing a thin powder layer on a smooth surface • a smooth surface such as a glass slide or a zero background holder (ZBH) may be used to hold a thin layer of powder • glass will contribute an amorphous hump to the diffraction pattern • the ZBH avoids this problem by using an off-axis cut single crystal • dispersing the powder with alcohol onto the sample holder and then allowing the alcohol to evaporate, often provides a nice, even coating of powder that will adhere to the sample holder • powder may be gently sprinkled onto a piece of double-sided tape or a thin layer of vaseline to adhere it to the sample holder • the double-sided tape will contribute to the diffraction pattern • these methods are necessary for mounting small amounts of powder • these methods help alleviate problems with preferred orientation • the constant volume assumption is not valid for this type of sample, and so quantitative and Rietveld analysis will require extra work and may not be possible
Sources of Error in XRD Data • Sample Displacement • occurs when the sample is not on the focusing circle (or in the center of the goniometer circle) • The greatest source of error in most data • A systematic error: • S is the amount of displacement, R is the goniometer radius. • at 28.4° 2theta, s=0.006” will result in a peak shift of 0.08° • Can be minimized by using a zero background sample holder • Can be corrected by using an internal calibration standard • Can be analyzed and compensated for with many data analysis algorithms • For sample ID, simply remember that your peak positions may be shifted a little bit • Can be eliminated by using parallel-beam optics