Case-Control Study Design
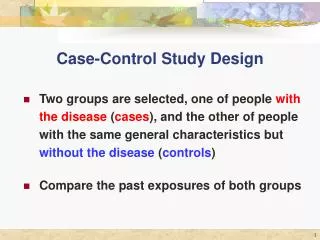
Case-Control Study Design. Two groups are selected, one of people with the disease ( cases ), and the other of people with the same general characteristics but without the disease ( controls ) Compare the past exposures of both groups. Case Control Study Design. Exposed. Diseased (Cases).

Case-Control Study Design
E N D
Presentation Transcript
Case-Control Study Design • Two groups are selected, one of people with the disease (cases), and the other of people with the same general characteristics but without the disease(controls) • Compare the past exposures of both groups
Case Control Study Design Exposed Diseased (Cases) Not Exposed Target Population Exposed Not Diseased (Controls) Not Exposed
Case-Control Study Design Limitations: • Cannot yield incidence rates because subjects are selected on outcome • An estimateof the ratio of incidence rates or risks (RR) is obtained by calculating an odds ratio (OR)
Odds Ratio Calculation Outcome Exposure Cases Controls Exposed A B Not Exposed C D Odds of exposure for cases A / C = Odds Ratio Odds of exposure for controls B / D (estimates the relative risk)
Comparing Odds Ratios and Relative Risks Outcome Exposure Cases Controls Exposed 70 300 370 Not Exposed 30 700 730 100 1000 1100 OR = AD/BC = 5.44 RR = Ie/In = 4.41
Stating your results • OR = 5.44 Those with the disease are 5.44 times as likely to have had the exposure compared to those without the disease • RR = 4.41 Those with the exposure are 4.41 times as likely to develop the disease compared to those without the exposure
Summary of Strengths and Limitations of Prospective Cohort and Case-Control Studies Prospective Cohort Case-Control Strengths: • Opportunity to measure risk factors before disease occurs • Can study multiple disease outcomes • Can yield incidence rates as well as relative risk estimates Strengths: • Useful for rare disease • Relatively inexpensive • Relatively quick results Limitations: • Possible bias in measuring risk factors after disease has occurred • Possible bias in selecting control group • Identified cases may not represent exposure of all cases Limitations: • Useful for rare disease • Relatively inexpensive • Relatively quick results
Randomized Clinical Trials(RCT) The Gold Standard Cohort Study
Schematic diagram of a clinical trial Study Population Non-participants Participants Randomization Treatment arm Control arm Intervention or new treatment Control Improved Not Improved Not Improved Improved
Crossover Design • Subjects are randomized to a sequence of two or more treatments • Each subject serves as his own control
Factorial Design • Two or more treatments are evaluated simultaneously in the same set of subjects using varying combinations of treatments Randomization Placebo Treatment A Treatment B Placebo Treatment B Placebo
How do we evaluate whether cancer studies are valid? Understand bias and confounding
Testing for a true association • Examine the methodology for bias • Examine the analysis for confounding • Examine the results for statistical significance
Examine the study design for Bias • Selection Bias • Errors in the process of identifying the study population and selecting the subjects • Information/Observation Bias • Errors in measurements of exposure or disease status
Confounding • Confounding is an apparent association between disease and exposure caused by a third factor not taken into consideration
Examples of Confounders • Study A found an association between gambling and lung cancer. The study may be confounded by smoking. • Study B found a larger crude death rate in Florida than in Alaska. The rate may be confounded by differences in the population age structure.
Testing for Confounding • Calculate the crude rate • Calculate a rate adjusted for the confounding variable • Compare the two measures • The two measures will be different if the variable is a confounder (in practice, when the crude and adjusted measures differ by at least 10%)
1980 U.S. Standard Population Expected Number of Deaths Population at risk Age Cancer Deaths ASR (1) / (2) = (3) (3) x (4) = (5) (1) (2) (4) 0-18 5 5,000 1.00 per 1000 60,500,000 60,500 0.40 per 1000 19-64 10 25,000 140,300,000 56,120 65+ 100 15,000 6.67 per 1000 25,700,000 171,419 Total 115 45,000 xxx 288,039 226,500,000 Crude Rate (115 / 45,000) x 1000 2.56 per 1,000 Age-Adjusted Rate (288,039 / 226,500,000) x 1000 1.27 per 1,000 Not equal AGE IS A CONFOUNDER FOR DEATH FROM CANCER
Evaluating Statistical Significance • The probability that you would get your results by chance alone is the p-value • A low p-value ( < 0.05 ) says that chance is not likely to explain your results • A 95% confidence interval (CI) is the range of values in which the true value will be found 95% of the time • Large samples yield small confidence intervals • Small samples yield large confidence intervals
Evaluating Results • RR = 1: No difference in disease between exposed and unexposed groups • OR = 1: No difference in exposure between cases and controls • Examples: • RR = 1.8 (1.6, 2.0) is statistically significant • RR = 1.8 (0.8, 2.9) is not statistically significant • OR = 0.7 (0.6, 0.8) is statistically significant • OR = 0.7 (0.4, 1.2) is not statistically significant
How do we assess whether associations between cancer and risk factors are causal? Understand criteria for causality
To Show Cause • Chronic disease and complex conditions require the use of Hill’s Postulates • Strength of association • Consistency of association • Specificity of association • Temporality • Biologic gradient • Plausibility • Coherence • Experiment • Analogy
How much of the morbidity and mortality from cancer might be prevented by interventions? Understand the impacts of education and screening programs
Principles of Screening • Validity • Sensitivity: correctly identify those with disease • Specificity: correctly identify those without disease • + Predictive Value: proportion of correct positive tests • - Predictive Value: proportion of correct negative tests • Reliability: ability of test to give consistent results • Yield: amount of unrecognized disease brought to treatment due to screening
Calculating Measures of Validity True Diagnosis Test Result Disease Total No Disease Positive a b a+b c Negative d c+d Total a+c b+d a+b+c+d Sensitivity = a/(a+c) Specificity = d/(b+d) Positive Predictive Value = a/(a+b) Negative Predictive Value = d/(c+d)
Example: Breast Cancer Screening Mammogram Results Disease No Disease Total Positive 132 983 1,115 Negative 45 63,650 63,695 Total 177 64,633 64,810 Sensitivity = 132/177 = 74.6% Specificity = 63,650/64,633 = 98.5% Positive Predictive Value = 132/1,115 = 11.8% Negative Predictive Value = 63,650/63,695 = 99.9%
Keys to Screening • Sensitivity: detect a sufficient number of preclinical cases to be useful • Prevalence: screen high-risk populations • Frequency: one-time screening does not allow for differences in individual risk or differences in onset • Participation: tests unacceptable to the target population will not be utilized • Follow-up: those with positive tests need to be provided with a plan of action
Advice for Reading the Literature • Identify the study design • Understand how subjects are selected • Understand how exposure is defined • Evaluate potential bias and confounding • Determine if the statistical evaluation is appropriate • Make decisions about whether the outcome measures are statistically significant and/or clinically important • Use good judgment