CASE CONTROL STUDY
CASE CONTROL STUDY. Case-control study. Exposure Disease (+) ? --------------------------------------------. Exposure Disease (-) ? --------------------------------------------. Investigator. Source population. Exposed. Unexposed. Source population. Exposed. Cases.


CASE CONTROL STUDY
E N D
Presentation Transcript
Case-control study Exposure Disease (+) ? -------------------------------------------- Exposure Disease (-) ? -------------------------------------------- Investigator
Source population Exposed Unexposed
Source population Exposed Cases Unexposed
Source population Exposed Sample Cases Unexposed Controls
Source population Cases Exposed Sample Unexposed Controls = Sample of the denominator Representative with regard to exposure Controls
Cases Controls Exposed a b Not exposed c d Total a + c b + d % exposed a/(a+c) b/(b+d)
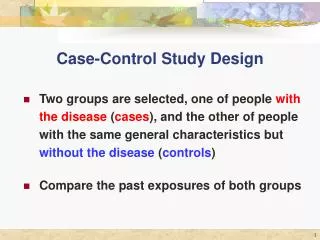
CASE-CONTROL STUDIES • Basic Idea: • Cases – Should represent all cases in the population • Controls – Should represent all persons without disease in the population
CASE-CONTROL STUDIES Sample Population
REVIEW • A design used to assess the relationship between the exposure to a risk factor and the development of a disease • It compares the exposure distributions between the groups of patients with and without the disease. • It typically uses only a fraction of the subjects in the non-disease group.
Characteristics of the Design • Retrospective • No randomization • Population at risk is often undefined • Ascertainment of exposure history
Implementation a Case-Control Study: Practical Issues • Selecting a study base representative of the intended population • Defining the disease • Choosing the cases and controls • Exclusion criteria • Ascertainment of exposure
Selection of the Study Base • Hospital based case-control studies: The study base is the collection of clinical records of the participating hospitals. • Berkson’s Bias: Cases and controls experience different hospital admission rates. • Population based case control studies: The Study base is the collection of subjects who would become cases if they develop diseases. • Neyman’s Bias: Case group not representative of the intended population.
Diagnostic Criteria and Case Selection • Diagnostic criteria: unambiguous definition under equal diagnostic surveillance. • Sources of cases: • Persons with the disease seen at a care facility in a specified period of time. • Persons with the disease in a more general population in a period of time.
Selection of Controls Basic Principles • True Representation of the Study Base: The controls should be selected so that they truly represent the distribution of exposure in the study base from which the cases are selected. • Comparable Accuracy: There should be no differential misclassification between the two groups.
Selection of Controls:Sources • The controls should be drawn from the population of which the cases represent the affected individuals. • Sampling Frames: • Population of an administrative area (eg. HMOs) • Hospital patients • Difference with target population • Cost effective • Relatives of the cases (spouses and siblings) • Associates of the cases (neighbors, co-workers, etc)
Matching • Frequency matching • Individual matching
Matching • Advantages: • Sometimes the only way of control of some confounding in certain situations • Increasing power • Straightforward way to obtain a comparable group
Matching • Disadvantages: • Some time impossible • Association between matching variable and the outcome can’t be assessed • Not possible to assess theadditive interaction between matching variable and exposure • Increased int validity may result in reduced ext. validity • Considering OVERSTIMATION: not highcorrelation between the variable of interest and matching variable • eg: matching ethnic background • No statistical power is gained if the matched variable is a weak confounder
Selection of Controls:Sampling Schemes • Total population – no sampling • Random and systematic sampling • Matching – deliberately select the controls in such a way as to make them similar to the cases with respect to certain confounding variables. • Multiple control groups.
Multiple controls • Similar • different
Exclusion Criteria • Exclusion criteria should not alter the exposure rate in one of the two groups. • Examples: • Low-level lead exposure and mental retardation-children with lead related diseases were excluded from the control group; • Reserpine and breast cancer-patients with thyrotoxicosis, renal disease, and cardiovascular diseases were excluded from the control group.
Information on Exposure • The most common sources of information on exposure are patients (or parents, in the case of children). • Other sources include relatives, hospital records, employment records, etc. • When information is obtained via interviews, recall bias is often a concern.
Information on Exposure:Comparability and Validity • Comparability: If the inaccuracy in exposure reporting affects the two groups to a different degree, the study may yields questionable conclusions. • Validity: The information on exposure reflects the true level of exposure.
Case control studies • epidemiologists use them to study a huge variety of associations. • more frequently than other analytical studies
Case control studies Advantages: • Rare diseases • Several exposures • Long latency • Rapidity • Low cost • Small sample size • No ethical problem • Efficient, cost-effective for rare outcomes
Case control studies Disadvantages: • Selection bias • Measurement of exposure information • Control of confounding factors • Not suitable for rare exposure • ? Sequence of events ? • Only one outcome • Does not yield incidence or relative risk (although in some cases these can be inferred using external information) • BIAS
INCIDENCE or PREVALENCE DISEASE or EXPOSURE Intuitively if the frequency of exposure is higher among cases than controls then the incidence rate will probably be higher among exposed than non exposed.
Distribution of cases and controls according to exposure in a case control study Cases Controls Exposed a b Not exposed c d Total a + c b + d % exposed a/(a+c) b/(b+d)
Distribution of myocardial infarction cases and controls by amount of physical activity Physical Myocardial activity Infarction Controls >= 2500 Kcal 190 230 < 2500 Kcal 176 136 Total 366 366 % exposed 51.9% 62.8 %
Probability that an event will happen Odds= Probability that the even will not happen Probability that an event will happen Odds= 1 - (Probability that the event will happen)
Case control study Odds of exposure among cases = Probability to be exposed among cases Probability to be unexposed among cases a / (a+c) Odds Ecases = ------------ = a / c c / (a+c) Odds of exposure among controls= Probability to be exposed among controls Probability to be unexposed among controls b/ (b+d) Odds Econtrols = ------------ = b / d d/ (b+d) Cases Controls Exposed a b Not exposed c d Total a + c b + d a/c OR = ---- = ad / bc b/d
CASE-CONTROL STUDIES • BASIC IDEA • Is the risk factor more common among casesthan controls? ODDS FOR CASES 50:50 = 1 ODDS FOR CONTROLS 20:80 = 0.25 ODDS RATIO = 50:50/20:80 = 1/0.25 = 4
RR isn’t possible to calculate in case control study • OR is calculated • OR is representative of RR if: • Cases are representative • Controls are representative • Disease prevalence is rare
CASE-CONTROL STUDIES • Method: Population-based • Prospective case-control • Cases: All incident cases of childhood (<15 yo) cancer in Denver registry, 1976-1983 • Controls: Random-digit dialing match on sex, age ± 3y
Analytical Issues • Association vs Causal relationship. • Adjustment of confounders: • Matching • Model based adjustment (regression, etc) • Propensity score method • A common limitation of the adjustment: cannot account for the effects of the unobserved confounders.
Final Thoughts • Thoughtful design and careful implementation. • Reducing biases of various kinds. • The workhorse of the case-control data analysis is logistic regression. • Reporting a case-control study.