GEODEMOGRAPHY
GEODEMOGRAPHY. the power of numbers. We are all drops in the ocean …. If you shook hands with people, night and day, for the rest of your life you could only meet about 1/5 of the people on the planet (assuming handshakes last 2 seconds) In short, get a different job!.


GEODEMOGRAPHY
E N D
Presentation Transcript
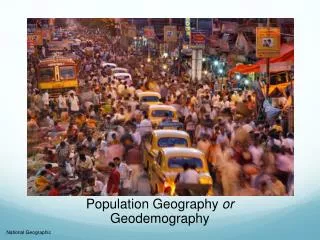
GEODEMOGRAPHY the power of numbers
We are all drops in the ocean … • If you shook hands with people, night and day, for the rest of your life you could only meet about 1/5 of the people on the planet (assuming handshakes last 2 seconds) • In short, get a different job!
Global Population Distribution Megalopolis Nile valley Haiti/Dominican Republic Java Buenos Aires
Sparse populations Some places too cold, too dry, too rocky, etc.
Dense populations Often in areas with good soils, ample rainfall, and water access
Dense urban settlement Ecological basis of population density becomes less and less meaningful with time because of: • Urbanization • International flows of goods, people, & money • International division of labor http://rose.ruru.ne.jp/pollux/natsu/natsuTop2.htm
Births per minute • U.K.: 1 • Japan: 2 • Russia: 3 • U.S.: 8 • Nigeria: 8 • Pakistan: 10 • China: 38 • India: 48 Not very useful!
Births and Deaths per minute • Russia: 3 births - 4 deaths = -1 • Japan: 2 births - 2 deaths = 0 • U.K.: 1 birth - 1 death = 0 • U.S.: 8 births - 4 deaths = 4 • Nigeria: 8 births - 3 deaths = 5 • Pakistan: 10 births - 3 deaths = 7 • China: 38 births - 16 deaths = 22 • India: 48 births - 17 deaths = 31 Somewhat useful … what could make it even more useful?
Annual Natural Change of Population What can we learn from this map? What can’t we learn?
Total Fertility Rate A better measure. What can’t we learn from TFR?
Is Global Population Growth a Problem? • “No, the world has more than enough resources if they are divided fairly” • The planet can physically support more than 10 billion people as long as they all share nicely. • Assumptions: • People are willing to share the resources they have, especially with strangers. • an optimistic view!
Let’s Get Real … • Whereas the U.S. currently uses 25% of the world’s resources … • And whereas the other 95% of the world would have to consume something like 5 times as much as they do now in order to equal our level, • And whereas their definition of an “adequate” standard of living is not far below our own … • The current growth of population is a problem.
Whose Problem is it? • If the poor countries develop over the next century to our levels of resource consumption, then the total rate of resource exhaustion, ecological disruption, and pollution will be about 10 times higher than today. • If the poor countries do not develop over the next century but continue to double in population every four decades, then we will have to deal with massive social unrest stemming from abject poverty, waves of poor immigrants, desperate refugees, epidemics, and political chaos. • No other country has as many resources to deal with the problem as the US • It will be our problem whether we want it or not!
Total Fertility Rate Zone of economic insecurity
Why do insecure people have more children? • Often they are rural • They seldom have access to the equivalent of welfare, social security, Medicare, and Medicaid • Often they are members of oppressed ethnic groups • Their world is quite different from the world we live in (religion, sex roles, economy, age roles, pass-times, access to contraception, knowledge about family planning, knowledge about children’s health, etc.)
Consequences of these considerations: • Children are useful in agricultural economies starting around 8 yrs. old • When children (at least male children) grow up they are expected to support their parents • Leaders in oppressed ethnic groups often advocate large families because they recognize the power of numbers (a minority that grows enough will no longer be a minority)
What are the consequences? • People in many poor capitalist countries are faced with a highly uncertain future • Periodic food shortages • Lack of employment • Political instability and inadequate policing • Diseases caused by lack of adequate sanitation • Diseases caused by industrial pollution • Lack of health care • They “insure” themselves by having more children than we consider “sensible” • At the individual level, their actions are sensible
Population pyramids What they are and what they can tell us about society & culture in different places
Average Age Why are the Europeans so old? Why are the Africans so young?
What causes the demographic transition? • Urbanization • Education • Secularization • Shift from subsistence to market economy • Government policies (in some cases)
What is the effect of the demographic transition? • During • Population growth • Migration • Urbanization • Persistence of traditional unequal gender roles • Conflict over social values and lifestyles • After • Economic development • Decline of conflicts over land • More egalitarian construction of gender roles & identities
Immigration to the U.S. Western European wave Asian and Latin American wave Southern and Eastern European wave
Immigration waves • Timing of immigration waves • Reflects the diffusion of the demographic transition from Western Europe towards the east and south, then to other parts of the world • This is the most complex diffusion process we have encountered • What is diffusing is not an artifact but a culture complex • The essence of this diffusion the spatial expansion of a process of demographic change • The impact on the US has been to re-define what it means to be “American” from a time when “White” meant English and/or German (and specifically not Irish, Italian, or Greek), to a time when “White” means of any European background (specifically not Asian, African (“one drop”) or Hispanic) • Future re-definition of “White”? • Abandonment of the term altogether?
Male-Female Ratio What might cause a surplus of males or females?
Females are less than 50% in some countries because: • Where girls are fewer it is usually because of: • Selective abortion • Infanticide • Deliberate neglect • Favoring boys nutritionally • All can be exacerbated by political and economic factors • Also, men may dominate population when women’s natural longevity is negated by • Early childbirth • Frequent childbirth • Lack of obstetric care
50,000,000 Missing girls
Is the child in the poster (promoting China’s one-child policy) a boy or a girl?
Factors affecting demographic patterns (complex causality) • Marriage age • Women’s education • Access to means of birth control • Government policy • Religion • Inter-group conflict • Economics • Disease • Language
Average Marriage Age for Women • Japan: • 26 • U.S.: • 25 • Mali & Niger • 16 • Hausa people living in Nigeria and Niger • 10-12
What impact do you think marriage age has: • On infant mortality? • On family size? • On women’s status in society? • On women’s educational level? • On health and disease levels?
Infant Mortality If you could do one thing to reduce infant mortality what would it be?
Education of Women • Lowers TFR (and thus improves child care) by improving the effectiveness of birth control • Lowers TFR (and thus improves child care) by reducing the need to have a boy as “insurance” against poverty in old age • Lowers maternal mortality rates (and thus improves child care) by delaying the onset of childbearing • Lowers maternal mortality making it easier for women to leave abusive and/or promiscuous husbands (nutrition, child care, and AIDS diffusion are affected) • Lowers infant mortality and maternal mortality by improving women’s ability to access a wide range of information on medicine, hygiene, and nutrition
Contraception Muslim countries have low contraception rates but do not have high HIV infection rates. Why? What would you predict about AIDS in Thailand?
“Mexico City Policy” • No US funds (USAID) are given to NGOs operating in foreign countries if they use any funds (even non-US funds) to provide abortions (excluding cases of rape, incest, & medical emergencies), or counsel about abortion, or lobby to keep abortion legal
Role of religion • Lays down standards pertaining to reproduction, but people respond to these standards in complex ways…