Download
1 / 37
370 likes | 581 Vues
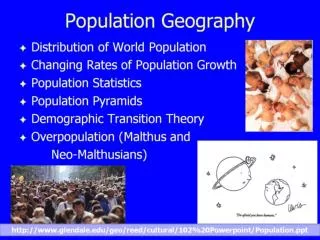
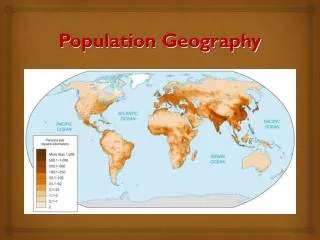
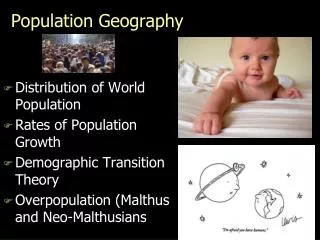
Population Geography or Geodemography. National Geographic. Objectives. Learn demographic terminology used to describe population trends. Identify major population centers and areas of growth as well as decline. Population Distribution Map. Population Map 2.

E N D
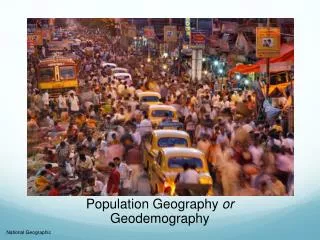
Population Geography or Geodemography National Geographic
Objectives • Learn demographic terminology used to describe population trends. • Identify major population centers and areas of growth as well as decline.
The World Population Distribution • What are some of the most populous countries? • Population concentrations • Two-thirds of the world’s population are in four regions: • East Asia • South Asia • Europe • Southeast Asia
Important Population Geography Terminology • Crude birth rate (CBR) - # of births per 1,000 population. • Total Fertility Rate (TFR) - Average # of children that a woman will have during her child-bearing years. • Crude death rate (CDR) - # of deaths per 1,000 population. • Infant Mortality Rate (IMR) - Annual # of deaths of infants under 1 year of age for every 1,000 live births. • Life Expectancy - Average # years an individual is expected to live. • GapMinder
Total Fertility Rates Infant Mortality Rates What do you notice?
Average Number of Children Per Woman Source: Population Reference Bureau
Discussion • Where is population growth the highest and the lowest? What explains this pattern? • What are the consequences of these patterns? http://www.ted.com/talks/lang/eng/hans_rosling_on_global_population_growth.html
Objectives • Define the rate of natural increase and doubling time. • Be able to describe the Demographic Transition and what critics say about it. • Interpret population pyramids.
Important Terminology Cont’d • Natural increase rate (NIR) • The percentage by which a population grows in a year. • NIR = (CBR-CDR) • Doubling time • The number of years it would take for a population to double.How Did We Get So Big So Fast?
World Population Growth Population Reference Bureau
The Demographic Transition Four stages • Stage 1: Low growth – preindustrial • Stage 2: High growth – early industrial • Industrial Revolution • Stage 3: Declining growth – late industrial • Stage 4: Low growth – post industrial • Zero population growth (ZPG)
Demographic Transition and World Population Growth • Increased rapidly during 2nd half of 20th century. • No country is in Stage 1, and few are in Stage 4. The transition is characterized by two big changes: • Technological advances – drops in death rates showing everywhere. • Changes in social customs resulting in declining birth rates…still waiting.
Population Pyramids • Population pyramids • A bar graph showing a population’s age and sex composition • Shape of the pyramid is determined mainly by the CBR
Importance of Population Pyramids Provide clues about how a population is going to change. Age distribution • Dependency ratio – the number of people too young or old to work compared to the number of those who can work. • Younger than 15 and older than 65. • Washington Post Sex distribution • Sex ratio – the number of males per hundred females in a population.
Objectives • Describe the arguments of Thomas Malthus and what current supporters and critics say.
Measures of Population Density • Arithmetic density Number of people in an area divided by total land area. • Physiological density Number of people supported by a unit of arable land. • Agricultural density Ratio between the # of agriculturalists or farmers per unit of farmable land in a given area.
Critical Issues in Population Geography • More people are alive today than at any other time! • The world’s population increased at a faster rate during the second half of the twentieth century than ever before. • The are more than double the people on the planet there were in 1960. • Virtually all population growth today occurs in less developed countries (LDCs).
Will We Face an Overpopulation Problem? Connecting population and the environment. Malthus on overpopulation • An Essay on the Principle of Population (1798): Population grows geometrically while food supply grows arithmetically Therefore, The Earth’s food supply cannot support our growing population. http://www.ucmp.berkeley.edu/history/malthus.html
Neo-Malthusians(People who Agree with Malthus) Two characteristics of recent population that raise concern: • Rapid population growth in Less Developed Countries (LDCs), happening more quickly than it did for More Developed Countries (MDCs). • Population growth strains resources available—food, energy, etc. So, they focus on more than food.
Critics of Malthus • Is a larger population really bad? Stimulate ideas and economic growth = more food production? Ex. of cornucopian theory. Ester Boserup! Food Insecurity:Others point out that poverty, hunger, and social issues are a result of unjust social andpolitical systems, not population. • Need to improve distribution. Ester from Wikipedia
Reality • Overall food production has increased, but not everyone can access food. • Population growth is slowing, BUT • People are living longer • More women are in their child-bearing years • Although fertility rates are decreasing faster in some less developed countries (LDCs) than they did in more developed countries (MDCs), Africa still has high TFR Currently, demographers project a world population of 9 billion in 2045, but this depends on choices we make today.
Questions for Discussion Who do you agree with about overpopulation? Malthus and the Neo-Malthusians or his critics? Why? Take a few minutes to write your thoughts out.
Country-Level Responses Japan India • Experiencing negative growth – where will workforce come from? • How has culture played a role? • Instituted “The Angel Plan” to ease burden of raising children and increase role of fathers. • Family planning policies started in 1950s. • Initially focused on forced sterilizations. • Recently focused on women’s rights and education. Source: NOVA
Take Away • Get comfortable with demographic terminology: crude birth rate, crude death rate, total fertility rate, infant mortality rate, rate of natural increase, doubling time, life expectancy and the three measures of population density. • What regions of the world have the highest rates of population growth? Lowest? • Demographic Transition: Be able to reconstruct and explain the chart, and offer criticisms. • Do watch the video on population pyramids. • Make sure to review Malthus’ theory, supporters and criticisms.