Population Geography
The world faces complex challenges due to exponential population growth, currently at 6.2 billion. This growth strains Earth's resources, threatening biotic capacity and ecological balance. Thailand's successful 1971 family planning policy sets a precedent, featuring high female literacy, economic advancement for women, and support from government and religious leaders. Conversely, China adopted stringent measures in 1979, including penalties for larger families. Understanding these approaches offers vital insights into managing demographic changes and promoting sustainable development.


Population Geography
E N D
Presentation Transcript
Population Geography The problems to be faced are vast and complex, but come down to this: 6.2 billion people are breeding exponentially. The process of fulfilling their wants and needs is stripping earth of its biotic capacity to produce life; a climatic burst of consumption by a single species is overwhelming the skies, earth, waters and fauna. -- Paul Hawken (www.paulhawken.com)
Thailand as an Example Can a country sharply reduce its population growth in only 15 years? • In 1971, Thailand adopted a policy to reduce population growth.
Thailand (cont) Several reasons account for this impressive feat: • the creativity of the government-supported family planning program • the high literacy rate among women (90%) • an increasing economic role for women and advances in women's rights • better health care for mothers and children • the openness of the Thai people to new ideas • the willingness of the government to encourage and financially support family planning and to work with the private nonprofit Population and Community Development Association (PCDA)(http://www.pda.or.th/eng/project_aids.htm) • support of family planning by the country's religious leaders (95% of Thais are Buddhist)
How is Population Size Affected by Birth and Death Rates? Populations grow or decline through the interplay of three factors: • births • deaths • migration
Demographic Birth & Death Rates • Crude Birth Rate (CBR) - the number of live births per 1000 people in a population in a given year. • Crude Death Rate (CDR) - the number of deaths per 1000 people in a population in a given year.
Crude Birth Rates(CBR) • annual number of live births per 1000 population. • It is "crude" because it relates births to total population without regard to the age or sex composition of that population.
Crude Birth Rate (cont) The crude birth rate of a country is strongly influenced by; • age structure of population • sex structure of population • customs & family size expectations • adopted population policies
Lowering Crude Birth Rates China's Way • In 1965 Chairman Mao stated an ever larger population was "a good thing," when China's CBR was 37 per 1000 and its population was 540 million. • In 1976 population reached 852 million although the CBR declined to 25.
China's Way (cont) "One couple, one child" became the slogan in 1979 backed by both incentives and penalties. • late marriages were encouraged
China's Way (cont) Single child families received: • free contraceptives • cash awards • abortions • sterilization
China's Way (cont) Penalties included: • steep fines for second births • sterilization of husband or wife of families with more than one child Penalties resulted in: • Infanticide
China's Way (cont) • Prosperous Urbanites • Successful Population Controls • Population Projections
China's Way (cont) Falling fertility rates will result in: • declining proportion of working-age people • inadequate number of people to care for rapidly growing number of senior citizens.
Factors Affecting Birth Rates Religious • Roman Catholics and Muslims Political • Italy • European governments
Crude Death Rate (CDR) • Crude Death Rate (CDR) - the number of deaths per 1000 people in a population in a given year.
World Birth/Death Rate Trend • Birth rates and death rates are coming down worldwide, but death rates have fallen more sharply.
World Population Change Rate expressed as a percentage: Annual rate of Birth rate - Death rate natural population = -------------------------------- change (%) 10
World Population Change (cont) • Exponential growth • World annual population growth rate • Actual Population change
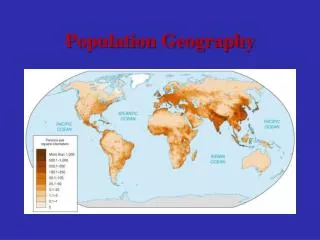
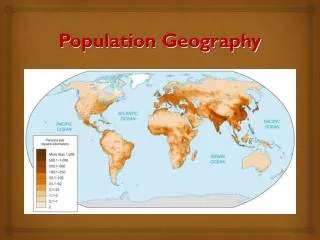
Population Number by Country • China (1.33 billion in 2010) and • India (1.2 billion in 2011) make up 37% of the world's population. • US (312 million as of 12/7/2011) has the world's third largest population but only 4.6% of the world's people.
Total Fertility Rate (TFR) • More refined that the crude birth rate. • Shows the rate of reproduction among fertile females 15 – 49 years old. • CBR the denominator includes the entire population including males and females not of reproductive age.
Population Projections • UN population projections to 2050 vary depending on the world's projected average TFR. • Next slide: UN population projections to 2050
Factors Affecting Birth Rates and Fertility Rates • Importance of children as a part of the labor force. • Urbanization. • Cost of raising and educating children. • Educational and employment opportunities for women. • Infant mortality rate. • Average age at marriage • Availability of private and public pension systems. • Religious beliefs, traditions and cultural norms. • Availability of legal abortions. • Availability of reliable birth control methods.
Typical Effectiveness Rates of Birth Control Methods in the U.S.
Typical Effectiveness Rates of Birth Control Methods in the U.S.
Typical Effectiveness Rates of Birth Control Methods in the U.S.
Demographic Transition As countries become industrialized, first their death rates and then their birth rates decline in four steps: • Pre-Industrial Stage • Transitional Stage • Industrial Stage • Post-Industrial Stage
Indicators of Overall Health • Two useful indicators of overall health of people in a country or region are: • life expectancy - the average number of years a newborn infant can expect to live • infant mortality rate - the number of babies out of 1000 born who die before their first birthday
Hans Rosling • Swedish medical doctor, academic, statistician and public speaker • http://www.youtube.com/watch?v=jbkSRLYSojo&feature=player_embedded
Demographic Transition As countries become industrialized, first their death rates and then their birth rates decline in four steps: • Pre-Industrial Stage • Transitional Stage • Industrial Stage • Post-Industrial Stage
2009 World Infant Mortality Rates • 2.75/1000 births: Sweden • 6.26/1000 births: U.S. (45th) • 151/1000 births: Afghanistan (almost last)
Factors Keeping the Infant Mortality Rate Higher than it Could Be • inadequate health care for poor women during pregnancy and for their babies after birth • drug addiction among pregnant women • the high birth rate among teenagers