Download
1 / 11
110 likes | 363 Vues
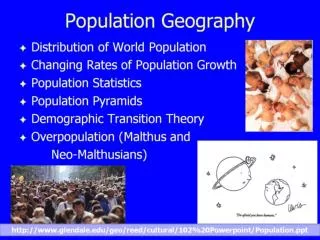
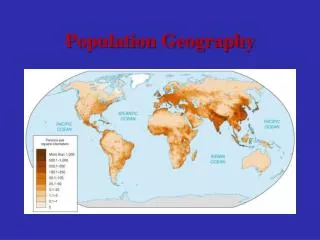
Population Geography. World POPClock Projection. Population Geography: number, composition, & distribution of human beings. Demography: the statistical study of human populations What does zero population growth mean? What was going on in Singapore since WW II?

E N D
Population Geography:number, composition, & distribution of human beings Demography:the statistical study of human populations • What does zero population growth mean? • What was going on in Singapore since WW II? • How many brothers and sisters do you have? • What is the income of your family?
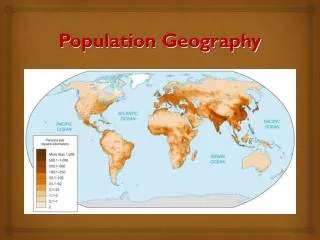
A. History of Human Population • Prehistoric time (5,000 years bp) … about 5,000,000 persons • Last year … 5,974,000,000 persons • Today … 7.1 billion! Oldest known stone tools in Africa (2,400,000 years bp) Earliest known use of fire (1,600,000 ybp) Homo sapiens sapiens inhabit Africa (200,000 ybp) Humans migrate out of Africa (100,000 ybp) Last ice age begins to recede (15,000 ybp) Farming begins (10,000 ybp) First Mesopotamian cities erected (5,000 ybp) • How much is a billion??? • What caused the increase? • What is the present situation? • What does the future hold? • Can the Earth support many more people?
B. “The Population System” • Basic components of population change: inputs & outputs • Inputs add to the system…outputs subtract Types of inputs and outputs: • Fertility: birth rates • Mortality: death rates • Net Migration: immigration (migration in) minus emigration (out)
C. Crude Birth Rate (CBR) • Birth rate is calculated by live births per 1,000 persons. • Less than 20 per thousand is a low birth rate • What is the highest? … • Niger with 50:1,000 • http://data.worldbank.org/indicator/SP.DYN.CBRT.IN/countries?order=wbapi_data_value_2012+wbapi_data_value+wbapi_data_value-last&sort=desc
D. Fertility Rates (TFR) TFR (total fertility rate): average number of live births per 1,000 women of child-bearing age * Rate of 2.1 is required just to REPLACE the present population to have ZPG (zero population growth) * Developed counties: TFR of 1.6 or less Developing countries: TFR of 3.6
Total Fertility Rates:http://data.worldbank.org/indicator/SP.DYN.TFRT.IN/countries
World population increase has been a result of declining death rates, NOT increasing birth rates.