Download
1 / 18
180 likes | 298 Vues
Measurement of D 0 production in pp. Andrea Dainese University of Padova. Outline. One step back: study of feed-down from beauty (b B D 0 ), important also for systematic error Estimation of statistical error on dN(D 0 )/dp T Estimation of systematic errors :

E N D
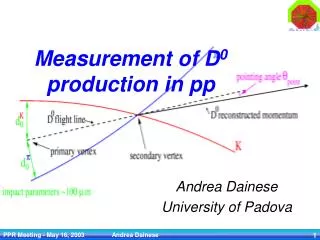
Measurement of D0 production in pp Andrea Dainese University of Padova PPR Meeting - May 16, 2003 Andrea Dainese
Outline • One step back: study of feed-down from beauty (b B D0), important also for systematic error • Estimation of statistical error on dN(D0)/dpT • Estimation of systematic errors: • contribution from beauty • uncertainty on D0 ct • MC corrections & uncertainty on B.R. to Kp • Combination of errors and error on total cross section PHYSICS PERFORMANCE: SENSITIVITY TO PPR Meeting - May 16, 2003 Andrea Dainese
Feed-down from Beauty (1) • At LHC energies • Fraction of D0 from chain b B0/B+ D0 not negligible • “Standard” NLO pQCD + Pythia fragmentation + PDG: • Important to use the correct ratio “D from b” / “D from c”: • Selection may change the ratio • Results have to be eventually corrected for feed-down estimate systematic error from b cross section 0.0017 0.64 0.0196 PPR Meeting - May 16, 2003 Andrea Dainese
Feed-down from Beauty (2) • How D0 signal was generated: • generate standard pp minimum bias with Pythia • keep only those events that have a D0 • weight D0s according to their pT in order to reproduce distribution given by NLO pQCD • In that sample: factor 4 too high! All candidates have been re-weighted: • c D: to reproduce pT distr. by NLO • b D: to have correct ratio (5.5%) AND reproduce THEIR pT distr. by NLO (harder than for c D !) PPR Meeting - May 16, 2003 Andrea Dainese
Feed-down from Beauty (3) After event reconstruction (tracking + vertexing): D0 from b / D0 from c = 5.8 % Different pT slopes After selection (impact parameter + pointing angle): D0 from b / D0 from c = 16 % PPR Meeting - May 16, 2003 Andrea Dainese
K p K D p B D V1 V1 Resolution on pointing angle is worse for D from c pointing angle enhances D from b Feed-down from Beauty (4) Selection on pointing angle expected to suppress D0 from b (they point to the decay vertex of the B and not to the primary vertex) 2<pT<3 GeV/c PPR Meeting - May 16, 2003 Andrea Dainese
20% ! D0 from b / D0 from c = 16 % Systematic error from b = uncertainty on b cross section fraction of D0 from b Feed-down from Beauty (5) Also selection based on impact parameter enhances beauty PPR Meeting - May 16, 2003 Andrea Dainese
D0 from b / D0 from c = 10 % Feed-down from Beauty (6) impact parameter distribution after selection new cut |d0|< 500 mm can suppress beauty PPR Meeting - May 16, 2003 Andrea Dainese
K id Results • Essentially unchanged w.r.t. to last shown (March) PPR Meeting - May 16, 2003 Andrea Dainese
Binning & “Smoothing” in dN/dpT • Optimize binning in the range 0-14 GeV/c: bin size increasing with pT • good precision on measurement of pT slope • small statistical error up to high pT • Fit pT distributions to remove fluctuations due to reduced statistics of simulation at high pT (especially for Bkg) • Use fitted function to obtain “smooth” dN/dpT for S and B PPR Meeting - May 16, 2003 Andrea Dainese
Statistical Error (1) • Rel. Statisitical error on S expected to be 1/Significance: S = (S+B)observed – Bestimated error on (S+B)observed = sqrt(S+B) error on Bestimated negligible (uses info from wide range mass distr.) error on S = error on (S+B)observed = sqrt(S+B) relative error on S = sqrt(S+B)/S = 1/Significance • This has been checked by generating and fitting a large number of invariant mass distributions, using as input parameters the results of the simulation, namely: • statistics for S and B VS pT • width of D mass distribution VS pT • slope of exponential bkg VS pT PPR Meeting - May 16, 2003 Andrea Dainese
0.5<pT<1 GeV/c Significance = 11 2<pT<2.5 GeV/c significance = 21 12<pT<14 GeV/c significance = 11 no systematic shift of integral (S) Pulls analysis err. given by fit = stat. err. on S Statistical Error (2) • Fit with expo + gaus • with 4 free parameters: • expo slope • gaus integral (S) • gaus mean • gaus sigma • (total integral fixed) • Many (10,000) iterations: • study resolution on S (statistical error) • study robustness of fit PPR Meeting - May 16, 2003 Andrea Dainese
~10% 2.4% Systematic Errors • When the data are corrected for efficiency, acceptance, etc… systematic errors are introduced • Main sources of systematic errors have been considered PPR Meeting - May 16, 2003 Andrea Dainese
Systematic from b subtraction • Fraction of D0 from b will be estimated from MC and subtracted to obtain D0 from c • Input to MC: • Beauty cross section in pp will be measured by all 4 expts • Now: pessimistic case use theoretical uncertainty (80%) • Error on N(c D0) = 0.8 N(b D0) • Relative error = 0.8 N(b D0)/N(c D0) 0.810% = 8% presentth. uncertainty PPR Meeting - May 16, 2003 Andrea Dainese
depends on ct in MC input assuming it is primary error ~ 0.5 % negligible lower cut on d0 upper cut on d0 charm beauty Systematic from ct = (123.4 0.8)mm • From selected to reconstructed D0: • For each D, calculated “equivalent” true value of ct = LM/p PPR Meeting - May 16, 2003 Andrea Dainese
Errors combined dN(D0)/dy for |y| < 1 and pT > 0.5 GeV/c (91% of pT > 0) statistical error = 3 % systematic error = 13 % from b = 8 % MC correction = 10% B.R. = 2.4 % Note: Error from MC may be lower than 10% and dep. on pT Error from b may be much lower after direct measure Error on BR doesn’t alter pT shape PPR Meeting - May 16, 2003 Andrea Dainese
Comparison with CDF-Run II • CDF Run II: preliminary measurement of charm cross section using the Secondary Vertex Trigger • sigma(D0, pT >= 5.5 GeV/c) = (13.3 ± 0.2 ± 1.5) µb 1.5% 11% • “We could measure the charm cross section in pp @ LHC from pT > 0.5 with the ~ same precision/accuracy” PPR Meeting - May 16, 2003 Andrea Dainese
Conclusions • Feed-down from b studied – important for systematic error • Statistical errors on pT distribution estimated • Main systematic errors considered • Physics performance on charm X section measurement in pp: • statistical error: 3 % • systematic error: 13 % (only indicative value) Systematic error from MC corrections will dominate • Next steps: • try D0 impact parameter to measure (b D0) / (c D0) “a la CDF” • sensitivity for comparison with NLO pQCD and/or Pythia • error analysis for Pb-Pb • play a bit with comparisons (RAA (pT) ….) PPR Meeting - May 16, 2003 Andrea Dainese