Carotenoid Gene Expression in Response to Light Levels for T2/Diploid Yeast
This supplementary figure shows the upregulation of carotenoid biosynthetic gene family expression in T2 yeast compared to diploid strains under excess light conditions. The gene expression data were derived from RNA-Seq transcript profiles and analyzed for significance levels using DESeq. Error bars represent standard error.
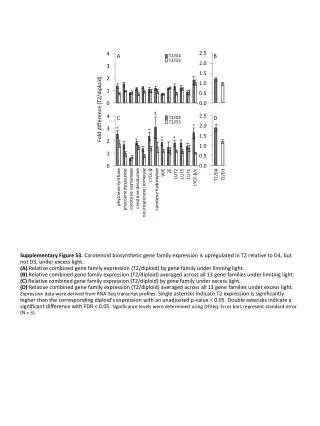

Carotenoid Gene Expression in Response to Light Levels for T2/Diploid Yeast
E N D
Presentation Transcript
T2/D4 T2/D4 T2/D3 T2/D3 A B Fold difference (T2/diploid) * * C D * * * * * * Supplementary Figure S3. Carotenoid biosynthetic gene family expression is upregulated in T2 relative to D4, but not D3, under excess light. (A) Relative combined gene family expression (T2/diploid) by gene family under limiting light. (B) Relative combined gene family expression (T2/diploid) averaged across all 13 gene families under limiting light. (C) Relative combined gene family expression (T2/diploid) by gene family under excess light. (D) Relative combined gene family expression (T2/diploid) averaged across all 13 gene families under excess light. Expression data were derived from RNA-Seq transcript profiles. Single asterisks indicate T2 expression is significantly higher than the corresponding diploid’s expression with an unadjusted p-value < 0.05. Double asterisks indicate a significant difference with FDR < 0.05. Significance levels were determined using DESeq. Error bars represent standard error (N = 3).