Download
1 / 17
180 likes | 214 Vues
This comprehensive study focuses on soil biota and the intricate dynamics controlling community and food web structures in terrestrial ecosystems. Explore top-down vs. bottom-up influences through litter enrichment, predator exclosure, and mesocosm experiments. Discover how stable isotopes like C and N are utilized to estimate trophic positions among soil organisms. Investigate decomposition processes, resource quality effects, and weight loss patterns. Gain insights into carbon and energy sources for decomposers and the diverse requirements of microorganisms in the decomposition process.

E N D
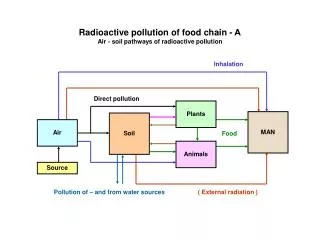
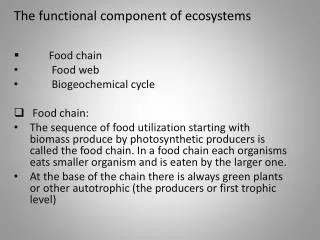
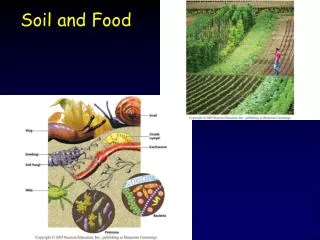
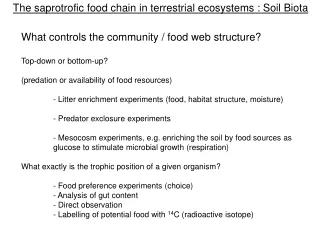
The saprotrofic food chain in terrestrial ecosystems : Soil Biota What controls the community / food web structure? Top-down or bottom-up? (predation or availability of food resources) - Litter enrichment experiments (food, habitat structure, moisture) - Predator exclosure experiments - Mesocosm experiments, e.g. enriching the soil by food sources as glucose to stimulate microbial growth (respiration) What exactly is the trophic position of a given organism? - Food preference experiments (choice) - Analysis of gut content - Direct observation - Labelling of potential food with 14C (radioactive isotope)
The saprotrofic food chain in terrestrial ecosystems : Soil Biota Using stable isotopes (C, N) to estimate trophic position • 15N / 14N ratio (δ15N) • Enrichment in 15N per trophic level in organisms (on average by 3.4 ‰) • Range of 15N / 14N ratios in given community indicates number of trophic levels • 15N / 14N increases with soil depth (thus species collonizing deeper soil layers • might contain higher 15N concentrations despite belonging to lower trophic level) • 13C / 12C ratio (δ13C) • Different ratio in C3 (e.g. wheat, rye, rice) and C4 plants (e.g. maize) • Measurement of incorporation of organic matter from defined food source • (e.g. C4 plant litter added to a system based on C3 plant production)
The saprotrofic food chain in terrestrial ecosystems : Soil Biota Using stable isotopes to estimate trophic position Trophic position and food resources of the soil animal community in two beech forests (Göttinger Wald – on limestone, mull humus, Solling – on acidic sandstone, raw humus)
The saprotrofic food chain in terrestrial ecosystems: Decomposition • The effect of resource quality on decomposition rate • Different tissue types have characteristically different decomposition rates • This applies to plant organs as well as to secondary resources as • - microbial tissues • - faeces and corpses of animals (phyto-, zoo-, saprophages)
The saprotrofic food chain in terrestrial ecosystems: Decomposition • For the same type of tissue there are species-specific differences in the rate of • decomposition. A tenfold difference between lowest and highest rates was found • in field experiments .
The saprotrofic food chain in terrestrial ecosystems: Decomposition • In a laboratory experiment a threefold range in decomposition was found with • mosses at the low and deciduous tree litter at the high end of the range.
The saprotrofic food chain in terrestrial ecosystems: Decomposition • Decomposition measured as weight loss includes losses due to • catabolism, • leaching, • removal or export following comminution. • When assessed saparately resource-specif rates are still apparent (see • results of litter bag experiment below) .
The saprotrofic food chain in terrestrial ecosystems: Decomposition • Differences in patterns of loss due to leaching probably reflect structural differences • in the substrates (below: leaves). For instance grinding of spruce litter increased the leaching loss in the first day by ca 10 times (simulation of comminution by soil • animals).
The saprotrofic food chain in terrestrial ecosystems: Decomposition • In a natural complex resource, • the total weight loss reflects the • summation of the decay curves • of the individual substrate fractions • (theoretical curve S in the chart). • The interaction between the components • (and possibly the production of new • ones) result in greater resistance to • decomposition than predicted by • considering the components individually • (as indicated by curve M in the chart).
The saprotrofic food chain in terrestrial ecosystems: Decomposition • The weight loss of the total litter and • most of its components approximates • to a negative exponential function. • Increase in crude protein and lignin: • Growth of micro-organisms, N-fixation, • in case of lignin possibly alteration • of extraction efficiency due to changes • in structure of decomposing substance • or due to synthesis of lignin-like • compounds by micro-organisms (extracted • in lignin-fraction).
The saprotrofic food chain in terrestrial ecosystems: Decomposition Carbon and energy sources – requirements of decomposers • Largest quantitative demand: energy released from organic substances • and carbon for tissue synthesis. • Plant tissues – high content of polysaccharides • vs Animal tissues – high protein and lipid contents • Microorganisms: composition of tissues adapt to high degree to composition of • food source! • High demand for N: can lead to N-immobilization in microflora when food-source • has high C/N ratio. • Nevertheless, new research confirm that for instance earthworms are limited by C • content of food source.
The saprotrofic food chain in terrestrial ecosystems: Decomposition
The saprotrofic food chain in terrestrial ecosystems: Decomposition In absolute numbers the weight loss of polysacharides is high, total decomposition will be determined by cell wall saccharides decomposition.
The saprotrofic food chain in terrestrial ecosystems: Decomposition • The presence of lignin retards the decomposition of cellulose.
The saprotrofic food chain in terrestrial ecosystems: Decomposition
The saprotrofic food chain in terrestrial ecosystems: Decomposition
The saprotrofic food chain in terrestrial ecosystems: Decomposition