Download
1 / 32
340 likes | 501 Vues
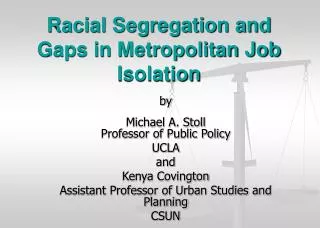
Kevin Parry. Measuring racial segregation at different geographic scales in Cape Town and Johannesburg 1991-2011. ISIbalo Symposium on Evidence Based Decision Making 12 September 2013. Background. Background. Source: Davies (1981).

E N D
Kevin Parry Measuring racial segregation at different geographic scales in Cape Town and Johannesburg 1991-2011 ISIbalo Symposium on Evidence Based Decision Making 12 September 2013
The level of segregation in South African urban space by census year, between whites and blacks, as measured by the index of dissimilarity Group Areas Act (1950) Repeal of the Group Areas Act 1994 elections Level of segregation 0 = perfect integration; 100 = total segregation From Christopher (2001)
Dealing with the apartheid city Pg 7: Urban settlements should be “spatially and socio-economically integrated, free of racial and gender discrimination and segregation.” Pg 11: The central prerequisite of meeting urban challenges: to overcome the historical patterns inherent in the apartheid city
Dealing with the apartheid city Pg 227: Spatial justice: apartheid’s policy of confining particular groups to limited spaces must be reversed. Pg 457: Social cohesion: improve public spaces and public services to make it easier for South Africans to interact with each other across the racial divide
Measuring racial segregation: Theil’s entropy index
Theil’s entropy index involves two calculations, which measure: Racial diversity represented by the symbol E Segregation represented by the symbol H Adapted from Iceland (2004)
25% 25% 25% 25% E 0 No diversity 1.386 Perfect diversity E: diversity
100% E 0 No diversity 1.386 Perfect diversity E: diversity
E E E E E H 0 Complete integration 1 Complete segregation H: segregation
5 476 values of E, one for each small area 1 value of E for entire study area Values of E for small areas compared to value of E for entire study area to obtain H for entire study area 1km2 8km2 H 7km2 H 6km2 H 5km2 H 4km2 H 3km2 H 2km2 H H
H 1.0 0.5 0.0 1km2 8km2 H 7km2 H 6km2 H 5km2 H 4km2 H 3km2 H 2km2 H H
Measuring segregation at different geographic scales: stylised segregation profiles for four regions
Racial diversity (E) scores for 1km2 grid cells: Cape Town, Census 2011
Racial diversity (E) scores for 8km2 grid cells: Cape Town, Census 2011
Racial diversity (E) scores for 1km2 grid cells: Johannesburg, Census 2011
Racial diversity (E) scores for 8km2 grid cells: Johannesburg, Census 2011
Segregation (H) profiles for Cape Town and Johannesburg, 2011
In both Johannesburg and Cape Town: • Residential segregation decreased between 1991 and 2011 • Despite this, segregation remains high in both cities • Johannesburg exhibits slightly higher segregation at large geographic scales, compared to Cape Town • Cape Town exhibits slightly higher segregation at small geographic scales, compared to Johannesburg
Christopher PJ 2001b. Monitoring segregation levels in South African cities: 1911-1996. South African Geographical Journal 83, 3: 249-257. Davies RJ 1981. The spatial formation of the South African city. GeoJournal Supplementary Issue 2: 59-72. Donaldson R & Kotze N 2006. Residential desegregation dynamics in the South African city of Polokwane (Pietersburg). Tijdschrift voor Economische en Sociale Geografie 97, 5: 567-582 Horn A 2005. Measuring multi-ethnic spatial segregation in South African cities. South African Geographical Journal 87, 1: 58-72. Iceland J 2004. The Multigroup Entropy Index (Also Known as Theil’s H or the Information Theory Index). University of Maryland. Available from: http://www.census.gov/hhes/www/housing/resseg/multigroup_entropy.pdf [Accessed 21 August 2012]. Lee BA, Firebaugh G, Matthews SA, Reardon SF, Farrel CR & O'Sullivan D. 2008. Beyond the Census Tract: Patterns and Determinants of Racial Segregation at Multiple Geographic Scales. American Sociological Review 73, 5: 766-791. South Africa (Republic of) 1997. Urban development framework. Pretoria: Department of Housing. South Africa (Republic of) 2012. National Development Plan 2030: Our future – make it work. Pretoria: National Planning Commission.