Download
1 / 26
260 likes | 276 Vues
Magnetic Fields at Hale Solar Sector Boundaries. Leif Svalgaard HEPL Stanford University Huntsville Workshop, 25 March 2014. Discovery of Sector Structure. Quasi-Stationary Corotating Structure in the Interplanetary Medium John M. Wilcox & Norman F. Ness ( 1965 ), JGR, 70, 5793.

E N D
Magnetic Fields at Hale Solar Sector Boundaries Leif Svalgaard HEPL Stanford University Huntsville Workshop, 25 March 2014
Discovery of Sector Structure Quasi-Stationary Corotating Structure in the Interplanetary Medium John M. Wilcox & Norman F. Ness (1965), JGR, 70, 5793. The large-scale structuring of the IMF was a surprise at the time IMP 1 Sector Boundary It was also noted that solar storms could briefly disrupt the structure
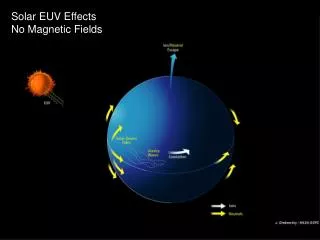
Organization is Robust (Recovers from occasional CME) V B n Heliospheric Current Sheet am Superposed Epoch ~1000 Boundaries
Rotation Plots of the Sector Polarity CH CH Skylab Workshop, 1976 1 27 Bartels Rotations
From the Surface to the Corona HMI 2011 WSO 1976 On Source Surface Potential Field Calculation
Almost 40 years ago one of our students published this paper in Solar Physics Dittmer concluded: "Although obscured by the lack of a reversal in the south, the pattern that emerges is one of flares preferring to occur near sector boundaries whose polarity agrees with that of bipolar active regions as given by the Hale polarity law."
The ‘Hale’ Boundary Concept.Svalgaard & Wilcox, 1976 Cycle Even A Hale Boundary is that portion of a sector boundary that is located in the solar hemisphere in which the change of magnetic polarity across the sector boundary is the same as the change of magnetic polarity from a preceding spot to a following spot. 2010, Cycle 24
We would predict from Dittmer’s finding that the Green Corona would have a Maximum at the Hale Boundary, and found precisely that: It was brighter over Hale boundaries and darker over non-Hale boundaries.
The Coronal Excess Brightness over Hale Boundaries switches abruptly at solar minimum
The Photospheric Magnetic Field [MWO] is at a maximum at the Hale Boundary Magnitude of the field measured at Mt. Wilson
And then this line of inquiry died Until I revisited the problem a couple of years ago, prompted by a discussion over lunch with Hugh Hudson
Perform Superposed Epoch Analysis of Photospheric Field with Sector Boundary Passages as Key Times Well-defined Sector Boundary List: http://www.leif.org/research/sblist.txt Select WSO magnetogram for five days before the SB crossing at Earth B + _ Bz V n Compute average magnetogram Kp
21 21 Unsigned (-,+) Unsigned (+,-) 22 22 Unsigned (+,-) (-,+) Unsigned 23 23 Unsigned Unsigned (+,-) (-,+)
Average Magnetogram for Nominal (+,-) Hale Boundary in the North The average magnetogram for a nominal (+,-) Hale boundary in the northern hemisphere. 910 magnetograms superposed on 765 sector boundaries for WSO observations 1976-2010. Some Data has been mirrored and sign-reversed as per Hale Polarity Law.
Variation of Nominal (+,-) Northern Hale Boundary MagnetogramThrough the Solar Cycle (21-24) 1st Third 2nd Third, Magnetic Field strongest at Maximum 3rd Third
As we have sector boundaries back to 1926 we can superpose the Greenwich Active Region data (kept up-to-date by David Hathaway). Left panel is for the number of regions and the right panel is for their areas.This slide is for odd cycles (+,-) (+,-) Odd Odd Area Count (-,+) (-,+) Odd Area Count
As we have sector boundaries back to 1926 we can superpose the Greenwich Active Region data (kept up-to-date by David Hathaway). Left panel is for the number of regions and the right panel is for their areas.This slide is for even cycles Even (+,-) (+,-) Even Area Count (-,+) (-,+) Even Even Area Count We see the now familiar pattern
Animation of Nobeyama 17 GHz disk maps superposed on nominal (+,-) sector boundaries in a nominal odd solar cycle. The Hale boundary is in the Northern Hemisphere. The animation starts 8 days before the sector boundary is at Central Meridian [a bright hexagon will flash] and runs until 6 days after CM passage Animation of a 17 GHz Hale Boundary
Animation of Nobeyama 17 GHz disk maps superposed on nominal (+,-) sector boundaries in a nominal odd solar cycle. The Hale boundary is in the Northern Hemisphere. The animation starts 8 days before the sector boundary is at Central Meridian [a bright hexagon will flash] and runs until 6 days after CM passage Animation of a 17 GHz Hale Boundary
Recent X7 Flare on Hale Boundary X7 X1 Is the magnetic field already ‘stressed’ when emerging if on a Hale Boundary? McClymont & Fisher (1989) make this case generally: the emerging flux adds already stressed magnetic fields directly to the lower solar atmosphere, storing the non-potential energy needed for flaring.
Iain Hannah plotted the position of all RHESSI (down to A-class) Flares occurring within ±24h of a Hale Boundary being at Central Meridian RHESSI flare list NOAA flare list And for the larger (>B1) GOES/NOAA Flares as well
Alternatively we can plot the latitude distribution of Flare Occurrence: Cycle 23, 1996-2008 Cycle 23, 2002-2008
Width the Advent of Cycle 24 the Distribution should ‘Reverse’, and it did: RHESSI, Cycle 24 RHESSI, Cycle 23
Conclusions I • The findings of Dittmer, Antonucci, Obridko, Wilcox, and Svalgaard are fully confirmed: Flares occur preferentially at Hale Sector Boundaries • The corona has maximal brightness over a Hale Sector Boundary • The magnetic field is strongest at Hale Sector Boundaries • More and stronger Active Regions occur at Hale Sector Boundaries • The findings have potential value for prediction of flare occurrence
Conclusions II • The warps of the Heliospheric Sector Structure originates preferentially from magnetic fields in one Hemisphere separated by a Hale Boundary where the polarity change matches that of bipolar active regions • There is a high degree of coherence in the organization of solar magnetic activity on large scales, which presumably links the sector structure to the deep interior of the Sun, reflecting a similar property in the creation of solar magnetism or its propagation to the surface • The solar sector structure is organized and long-lived, and flaring also has the same degree of spatial and temporal structure Thank you
Abstract Interplanetary 'Sector Boundaries' separating opposite magnetic field polarities can be traced back to the photospheric magnetic field. The portion of such a boundary that separates magnetic fields with the same change in polarities as that between the leading and trailing parts of active regions is called a Hale Boundary and is found to be the site of high magnetic field strengths, high occurrence of solar flares, enhanced radio microwave emission, and maximum brightness of the corona. As sector boundaries are very long-lived [years or more], Hale Boundaries must be similarly organized on long timescales, suggesting long-lived internal magnetic structures or cells with excess free energy, i.e. be already stressed by internal processes to harbor that energy released in flares and CMEs. This has obvious implications for short-term predictions of space weather.