Download
1 / 10
100 likes | 240 Vues
U.S. Geological Survey Woods Hole Field Center Background, Data & Visualization. Matthew Arsenault USGS Woods Hole Science Center. Coastal & Marine Geology Program (CMGP) Publications: usSEABED Sediment Database.

E N D
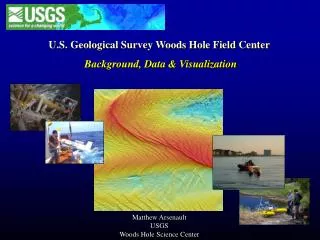
U.S. Geological Survey Woods Hole Field Center Background, Data & Visualization Matthew Arsenault USGSWoods Hole Science Center
Coastal & Marine Geology Program (CMGP) Publications: usSEABED Sediment Database Current usSEABED data coverage (~340,000 data pts) and sediment mean grain size
WHSC Sea Floor Mapping Geologic Mapping of the Sea Floor Integration of surficial & sub-bottom geophysical data, sediment grab, core, video, and photographic data Sidescan Sonar Seismic Reflection Swath Bathymetry Bottom Video and Photographs Samples Sediment Core and Grab Samples
USGS Coastal & Marine Geology Program Why Visualization? • Just a few years ago…we were still here in “flat mapland”
USGS Coastal & Marine Geology Program Why Visualization? • Just a few years ago…we were still here in “flat mapland”
USGS Coastal & Marine Geology Program Why Visualization? Cognitive learning studies show that geologists & earth scientists self-select to be able to understand the relationship between 2D maps and the 3D world.
Woods Hole, MA Complexities of High-Resolution data RepeatabilityMonitoring Change in Shoal Morphology Middle Ground (sand shoal), Vineyard Sound, Massachusetts Water Depth ~5 – 20 m 800 m Bedform Height~1- 6 m Martha’s Vineyard 1200 m Rich Signell,USGS