Download

1 / 16
160 likes | 313 Vues
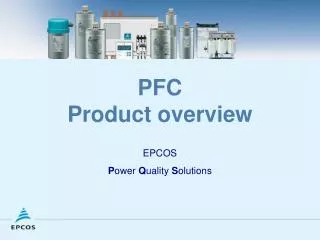
Porosity of Permeable Friction Courses (PFC). Brandon Klenzendorf April 28, 2009 CE 397 – Statistics in Water Resources. PFC Introduction. Layer of porous asphalt 1 to 2 inches thick over impervious roadway surface Water enters pore space and provides benefits : Reduced splash/spray

E N D
Porosity of Permeable Friction Courses (PFC) Brandon Klenzendorf April 28, 2009 CE 397 – Statistics in Water Resources
PFC Introduction • Layer of porous asphalt 1 to 2 inches thickover impervious roadway surface • Water enters pore space and provides benefits: • Reduced splash/spray • Improved traction • Reduced hydroplaning • Improved water quality • Pores become cloggedwith sediment over time resulting in a loss of porosity • Can we predict the extent of clogging over time? Conventional Asphalt PFC Overlay
PFC Cores • PFC cores are extracted from three roadwaysfor the past three years: • Loop 360 • FM 1431 • FM 620 • March 2007 • February 2008 • February 2009 PFC layer
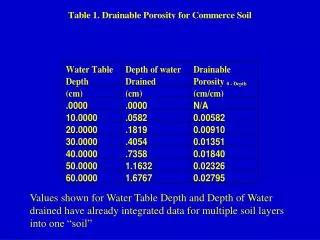
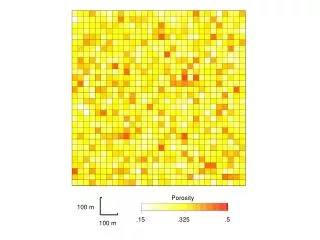
Porosity Data • 33 total porosity measurements
Statistical Tests • Kruskall-Wallis Test • H0: all groups have identical distributions • Reject H0 if K ≥ Kα (from tables) • Mann-Whitney Test (Rank Sum Test) • H0: the means of two groups are identical • Reject H0 if T ≤ Tα/2 (from tables)
Test Results • Kruskal-Wallis Test
Test Results • Compare two years of Loop 360 porosity • Mann-Whitney Test • Extend this analysis to the other roadways • Extend this analysis to individual years
Trends in Porosity • Multiple variables can influence PFC porosity • Life of pavement • Traffic volume • Precipitation • Roadway geometry (slope, width, etc.) • Nearby construction sites, etc. • Only consider first four variables
Traffic Volume • Estimate annual average daily traffic (AADT) • Linear regression from 16 years of data
Precipitation • LCRA Hydromet data for Loop 360 and FM 1431 • Need to find precipitation data for FM 620
Future Work • Complete multiple variable trend analysis • Write final report • Extend this analysis to hydraulic conductivity data (data set not complete) • Determine correlation between porosity and hydraulic conductivity • How can these measurements be used to predict PFC benefits (water quality)?
Outline • PFC Introduction • Porosity Data • Statistical Tests • Kruskall-Wallis Test • Mann-Whitney Test • Test Results • Trend Analysis • Future Work
Test Results • Compare porosity in travel lane to shoulder on Loop 360 • Both Kruskal-Wallis test and Mann-Whitney test
Porosity Submerged specific weight device Remove impervious base material Vacuum sealed core