Download
1 / 18
260 likes | 1.13k Vues
Values shown for Water Table Depth and Depth of Water drained have already integrated data for multiple soil layers into one “soil”. Calculation of Drainable Porosity .

E N D
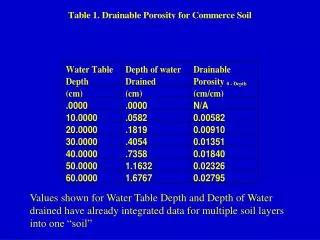
Values shown for Water Table Depth and Depth of Water drained have already integrated data for multiple soil layers into one “soil”
Calculation of Drainable Porosity. The drainable porosity if the water table is lowered from Depth 1 to Depth 2 is (Drained Volume Depth 1 — Drained Volume Depth 2) Drainable Porosity Depth 1 - Depth 2= ------------------------------------------------------------------ (Depth 1 —Depth 2)
Example 1. The drainable porosity if the water table is lowered from 0 cm to 30 cm isDrainable Porosity 0-30 = (0.0 cm -.4054 cm)/(0 cm-30 cm) = (-0.4054 cm)/(-30 cm) = 0.0135 cm/cm
Example 2. The drainable porosity if the water table is lowered from 10 cm to 30 cm isDrainable Porosity10-30 = (0.0582 cm -.4054 cm)/(10 cm-30 cm) = (-0.3472 cm)/(-20 cm) = 0.01736 cm/cm
Example 3. The drainable porosity if the water table is lowered from 0 cm to 20 cm isDrainable Porosity0-20 = (0.0 cm -.1819 cm)/(0 cm-20 cm) = (-0.1819 cm)/(-20 cm) = 0.0091 cm/cm
Notice that drainable porosity is specific to the initial and final water table depths being evaluated. Drainable Porosity0-20 = 0.0091 cm/cm Drainable Porosity10-30 = 0.01736 cm/cm Drainable Porosity 0-30 = 0.0135 cm/cm
Drainable Porosity Use in Scope and Effect Equations -- drainable porosity is used directly in the van Schilfgaarde equation. -- in the Ellipse and Hooghoudt equations it is used as follows to calculate a drainage rate q. (f*depth water table lowered) + rainfall - evapotranspiration q= t t = time to lower water table for most critical period during the growing season
Presence of Water Table --It is critical that the user of this information, before applying it to a site, affirm that the site does support a water table situation. --The Scope and Effect equations and DRAINMOD apply to unconfined aquifers where a free water surface, a water table, can be found. -- Often this water table will be a perched water table, created by a restrictive layer that prevents the continued downward flow of soil moisture. -- MUUF will calculate the soil hydraulic properties for any valid input soil data set. It is the responsibility of the user to ascertain if a water table is present, the timing, extent, and duration of the water table, and that no measured data exists for the soil.
Figure 2. Output from MUUF in DRAINMOD input format (COMMERCE.SIN). COMMERCE Soil Name 2121 # of Entries in Soil Moisture (1st two digits) and Drained Volume (2nd two digits) Tables .44547 .0 .43906 -5.0 .43107 -10.0 .41520 -20.0 .40090 -30.0 .38837 -40.0 .36778 -60.0 .35162 -80.0 .33853 -100.0 .31427 -150.0 .29720 -200.0 Soil Moisture Characteristic Curve Data (21 entries) .27394 -300.0 Column 1 Column 2 .26703 -340.0 Moisture Content Matric Potential .25827 -400.0 (cm3/cm3) (cm) .23755 -600.0 .21385 -1000.0 .18589 -2000.0 .15552 -5000.0 .13678 -10000.0 .12681 -15300.0 .09343 -102000.0
.0000 .0000 .2000 10.0000 .0582 .2000 20.0000 .1819 .1229 Water Volume Drained - Upward Flux Table 30.0000 .4054 .0790 (21entries) 40.0000 .7358 .0508 50.0000 1.1632 .0339 Column 1 Column 2 Column 3 60.0000 1.6767 .0239 Water Table Depth of Water Upward 70.0000 2.2670 .0172 Depth Drained Flux 80.0000 2.9257 .0116 (cm) (cm) (cm/hr) 90.0000 3.6458 .0091 100.0000 4.4214 .0071 120.0000 6.1197 .0046 140.0000 7.9880 .0031 160.0000 10.0017 .0022 200.0000 14.3934 .0012 250.0000 20.4605 .0006 300.0000 26.9986 .0000 400.0000 41.1890 .0000 500.0000 56.5111 .0000 700.0000 89.5809 .0000 1000.0000 143.3694 .0000
10 # of entries in Green-Apmt Table .00 .00 .00 20.00 .20 1.61 Green-Ampt Infiltration Parameters (10 entries) 50.00 .50 1.83 80.00 .71 1.88 Column 1 Column 2 Column 3 120.00 .91 1.91 Depth A B 160.00 1.05 1.93 (cm) (cm2/hr) (cm/hr) 250.00 1.27 1.95 400.00 1.48 1.96 700.00 1.71 1.97 1000.00 1.84 1.97 3 # of Horizons in Ksat Table 5. 2.78 Column 1 Column 2 13. .88 Horizon Depth Ksat 30. 1.61 (in) (cm/hr) .12681 Wilting Point Moisture Content (cm3/cm3)
Availability of MUUF 2.14 The National Water and Climate Center has made the MUUF program and data available as downloadable files on their server ftp://ftp.wcc.nrcs.usda.gov/water_mgt/muuf/ There is no technical support for MUUF or its data. The user will have to download the MUUF program and the soils data by state. Directories and paths will have to be correctly established for the program to operate. Once the input data set is ready, the program can be run for the desired output type (DRAINMOD, WEPP, general, etc
FUTURE STATUS Work is currently underway which will allow the resources of the NASIS database to be utilized in the ROSETTA program for calculating soil hydraulic properties. The Soil Water Characteristic feature of SPAW can also be used to obtain soil hydraulic properties (Hydraulic Conductivity, Soil Moisture Characteristic Curve) needed to evaluate drained volume and “f” (drainable porosity)
Validation of Procedure Mohammad (1989) evaluated the NRCS method (MUUF) of predicting soil hydraulic properties by comparing the computed volume drained and upward flux using the predicted soil hydraulic properties and measured soil hydraulic properties for 53 and 34 soils, respectively. - The NRCS procedure was found to provide good results for estimated volume drained across all soil types except sandy loam. - The program tended to under predict the volume drained by about 13%. - Also the error was less for estimations at deeper water table depths (>50 cm). - The NRCS procedure was found to provide good results for maximum upward flux across all soil types, but tended to under predict the upward flux by about 11%, although the method over predicted maximum upward flux at shallower water table depths (<75 cm).
Validation of Procedure Gijsman et al (2002) evaluated eight methods for water retention parameters. No method performed well for very sandy soils. The Soil Water Characteristic seemed most acceptable, and MUUF was found to provide high porosity values.
SOIL PROPERTIES Name: SAN JOAQUIN Number of Horizons: 4 Root Zone Depth : 0. Dp rf ca clay silt om cs mp cp dbmom flag Ksat 14. 2.7 .70 20.0 37.8 .8 5.5 2 3 .00 0 .69 4 2.7 .70 39.5 31.3 .3 3.1 2 3 .00 0 .10 12. .0 .70 .0 .0 .1 .0 2 2 .00 0 68.62 30. 4.1 .70 17.5 39.5 .0 5.8 1 2 .00 0 .58
DEPTH OF DRAINED UPFLUX FROM GREEN-AMPT WATER MATRIC WATER WATER WATER PARAMETERS CONTENT SUCTION TABLE VOLUME TABLE A B (THETA) (HEAD) (cm) (cm) (cm/hr) (sq.cm/hr) (cm/hr) (cc/cc) (cm) ------------------------------------------------------------------------------------ .0 .0 .2000 .00 .00 .42 .0 10.0 .0 .2000 .04 .69 .42 -5.0 20.0 .1 .2000 4.41 28.11 .42 -10.0 30.0 .2 .2000 4.93 18.93 .41 -20.0 40.0 .3 .1651 5.28 14.35 .41 -30.0 50.0 .5 .1170 5.52 11.59 .40 -40.0 60.0 .8 .0856 5.69 9.76 .39 -60.0 70.0 1.0 .0666 5.80 8.45 .38 -80.0 80.0 1.4 .0522 5.88 7.46 .37 -100.0 90.0 1.8 .0406 5.94 6.70 .35 -150.0 100.0 2.2 .0337 5.97 6.09 .33 -200.0