Understanding World Population Growth and Demographics
250 likes | 334 Vues
Explore the dynamics of world population growth, demographic transitions, and the impact of immigration on countries like Canada. Learn about the demographic transition model, age structure, birth rates, and more. Discover the challenges and benefits of varying population trends.

Understanding World Population Growth and Demographics
E N D
Presentation Transcript
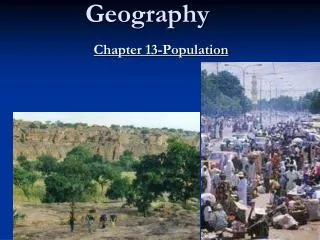
Geography Chapter 13-Population
Figure 13-1 : To Making a graph • Pg.316-324 • World Population Growth • -3 times greater in the 20th century • -6 billion in 1999 • -7 billion by 2020-watch pop. Video clip
Definitions Demography-statistical study of human populations emigration-leaving a country to live elsewhere—Emigrate from Poland to Canada immigration-coming into a country to live—Immigrate to Canada from Greece migration-moving from one area to another (within a country-aka internal migration) census- done every 10 years in Canada and a general one every 5 years. (pg.318)
Demographics of Canada, Data of FAO, year 2005 ; Number of inhabitants in thousands.
developed countries-a country with a highly developed economy, with a strong service sector and often an industrial base. high standards of living with high levels of literacy, health services, and food supplies • developing countries- a country with an economy that depends more on primary industries, and citizens have a lower standard of living than those in developed countries.-watch clip
Crude birth (or death) rate= (number of births(or deaths)/population) * 1000 • Rule of 70- how long is doubling time for a population? • Equation=70/percent growth rate • Population Growth Rate=(net migration rate) + (birth rate – death rate) • Canada’s immigration includes economic migrants, refugees escaping persecution. • The result of immigration to countries like Canada and the US is a multicultural population
Life before 1700’s Hobbes describes it as « poor, nasty, brutish, and short » • Life expectancy was 30 years • Why? Disease, poor medical care, poor nutrition, unsanitary living conditions • After 1750 death rates declined • Why? Increases in food production (agricultural revolution), hygiene, and medical knowledge. • Eventually there was a decreases in the birth rates in the more developed countries • Why? People began to move into cities (children were not as needed to work in fields), increase in the standard of living, and economic development
Demographic Transition Model : changes over a period of time in three elements : birth rates, death rates, and trends in overall population numbers. Stage 1 : High birth rates and high fluctuating death rates result in small population growth. Why? Plagues, diseases, and poor nutrition keep mortality high. (many countries in Africa today) Stage 2 : Birth rates are still high, so there is a rapid increase in population numbers. Why? Improved health care, sanitation, and increased food supplies lead to a rapid fall in death rates. (Kenya) Stage 3 : Population growth begins to decline. Birth rates begin to fall. Why? Industrialization, urbanization, and improved living standards lead to less desire for large families. (China)
Stage 4 : The transition is complete to a low growth rate with low birth rates and death rates. The birth rate may fluctuate in special circumstances, such as the post-war « baby boom ». (Canada) • Stage 5 : Birth rates drop below death rates. This is happening in some European coutnries and in Japan. It is not known if this trend will extend to other regions. Why? You tell me… (Austria) http://www.youtube.com/watch?v=0dK3mL35nkk&feature=related-watch clip
Defintion: Please Include! Fertility Rate: Number of children a woman can have over her lifetime Problems Very High Birth Rates -insufficient medical services- high infant mortality -insufficient government funds for education of a large, young population. Very Low Birth Rates -a shortage of workers and entrepreneurs for the future, unless countries accept high levels of immigration. -fewer young people to care for aging parents, resulting in expensive care facilities Canada Now -has a low death rate and a falling birth rate Stage 4 right now in the demographic transition model. http://www.footwork.com/pyramids.asp
http://www.cdli.ca/courses/geog3202/unit06_org03_ilo02/b_activity.htmlhttp://www.cdli.ca/courses/geog3202/unit06_org03_ilo02/b_activity.html
Age structure of Canadian population, 2001 Males Females AgeGroup Number Per cent Number Per cent 0-4 868,075 2.9% 828,210 2.8% 5-9 1,011,460 3.4% 964,675 3.2% 10-14 1,051,450 3.5% 1,001,665 3.3% 15-19 1,052,145 3.5% 1,001,180 3.3% 20-24 982,280 3.3% 973,530 3.2% 25-29 935,510 3.1% 962,685 3.2% 30-34 1,041,255 3.5% 1,065,490 3.6% 35-39 1,245,000 4.1% 1,277,855 4.3% 40-44 1,271,725 4.2% 1,307,040 4.4% 45-49 1,151,155 3.8% 1,182,380 3.9% 50-54 1,033,365 3.4% 1,052,395 3.5% 55-59 789,205 2.6% 805,030 2.7% 60-64 621,570 2.1% 652,215 2.2% 65-69 543,825 1.8% 589,800 2.0% 70-74 461,785 1.5% 547,430 1.8% 75-79 338,820 1.1% 474,850 1.6% 80-84 192,645 0.6% 323,490 1.1% 85+ 125,580 0.4% 290,325 1.0% Totals 14,716,850 49.0% 15,300,245 51.0% The Age Structure of Populations Age structure : composition of the population of a country based on the age groups of the population. Demographers divide in three : 1) children up to the age of fifteen 2) working adults from ages sixteen to sixty-four 3) adults sixty-five and older.
Dependency ratio : proportion of the population that is being supported by the working age1+3 being supported by 2 • Dependency ratio = ((% under 15) + (% over 65)) / (% 15 to 64) x 100 • Canada=121% • Canada=312% therefore dependency load is 33% • Bangladesh=147% • Bangladesh=36% therefore dependency load is 53% • Age structure provides us with insights into problems that could arise in the future resulting from a predominantly old or young population.
Population Pyramids • Population Pyramid : a graph that shows the age and sex structure of a population. • A series of horizontal bar graphs for the male and female populations are placed back to back at age intervals of five years, called cohortsstructure of a population. • Countries with high birth rates have many children and an expanding population. A stable population will have birth rates and death rates in balance, and a contracting population will have below higher death rates than birth rates. • In general • expanding pyramids=developing nations • Stable pyramids=developed countries • http://www.census.gov/ipc/www/idb/pyramids.html • http://www.ined.fr/jeux.php?_movie=/flash/d03/EN/D03WebSon.swf&titre=Population%20pyramid&lg=en • http://www.ngfl-cymru.org.uk/vtc/demographic_trans/eng/Introduction/Plenary.htm • http://www.ined.fr/jeux.php?_movie=chargement.swf?_movie=simulateur.swf&lg=en&titre=Population%20simulator&lg=en&jeu=ok • http://www.statcan.gc.ca/kits-trousses/animat/edu06a_0000-eng.htm • New use this one above! Early expanding Expanding
Contracting Stable Watch population pyramid video
Can you match these population pyramids to the demographic transition model? Take a few minutes with a partner and look at the DTM and match it with population pyramids For each stage! http://www.geographyalltheway.com/igcse_geography/population_settlement/population/igcse_popn_structure_revision.htm
Canada’s population : The Past and the Future • Why is an aging population considered a problem? • Increase in medical and social servicesgovernment will need to spend money • What is a population pyramid? What is its purpose? • Statisticspopulation divided into gender and ages of people in area • Balance between males/females • Dependency ratio • Stages of demographic transition • Rate of population growth • What are the effects of migration? • Increase in immigrantsIncrease in workers & entrepreneurs • Increase in immigrantsPayments of social and medical services due to taxes • What if there was no immigration? • Population decreases • Aging population increases
The One-Child Policy-China’s solution pg.331 Mountains and cold desert prevent western China from supporting many people. 1980-the government imposed the one-child policy to combat a 900 million people population and a 1.57 percent annual growth rate Results of the Policy Positive : birth rate cut in half rapidly. worked well in urban areas where people recognized it allowed them luxuries. two children permitted if the first born was a daughter or was disabled. Negative : sons are valued as labourers and ‘old age security’ so forced abortion and infanticide can occur if the first-born is a girl especially in rural areas ‘Little Emperor Syndome’ -single-child families have evolved where child feels no obligation to family or society. The policy is often ignored in rural areas China’s population pyramid http://www.iiasa.ac.at/Research/LUC/ChinaFood/images/anim/ch_all2.gif--click on bottom image during ppt http://www.iisg.nl/~landsberger/pop.html Watch China Video
Where do Six Billion People Live? Why are there more people in some areas of the world than in other parts? Population distribution : the way people are spaced over the earth’s surface. Ecumene : The populated area of the world Population density : number of people in given area of land. (KMSQUAGE)
World Population Distribution – Dependent on the GEOGRAPHY! The most densely populated areas are north of the equator : Europe, Asia Relationship to Landforms : Lowland areas- are the most heavily populated (coastlines and river valleys in, for example India, China, and Egypt) Highland areas- sparsely populated, rugged and cold, exception being in Switzerland, Japan, Java and Philippines. Relationships to Climate : very low populations in extremely cold and dry regions, some exceptions being Israel (irrigations) and Kuwait (oil wealth).
Population distribution : the pattern of where people live in an area. • How is population distribution measured? • Crude densitiesshows how much one area can accommodate in terms of population • Population density=population/area • Not accurate • Example Canadamost of population lives in a small area; not a lot of population live in large areas—population concentrated in cities. • Nutritional densities : how much nutrition (in calories) can be produced from the land • Area with good soil, adequate temperature, and rain for plants to grow have a higher nutritional density • In the developing world, nutritional density is low • Can the population of the world be fed? • What was Malthus’ Idea? – go to page four of your Geography package if you can’t remember Countries with poor nutrition
http://www.bbc.co.uk/apps/ifl/schools/gcsebitesize/geography/quizenginehttp://www.bbc.co.uk/apps/ifl/schools/gcsebitesize/geography/quizengine http://www.geography.learnontheinternet.co.uk/activities/population.html http://www.geography.learnontheinternet.co.uk/activities/population.html