Download
1 / 10
100 likes | 216 Vues
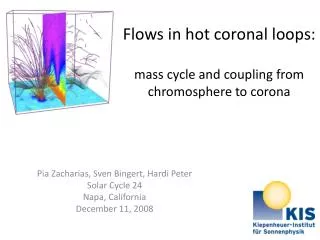
Flows in hot coronal loops : mass cycle and coupling from chromosphere to corona. Pia Zacharias, Sven Bingert , Hardi Peter Solar Cycle 24 Napa , California December 11, 2008. 10. 10 5 K. 6.5 10 5 K . 5. 0. Peter (1999) ApJ 516, 490 .

E N D
Flows in hot coronalloops:masscycle and couplingfromchromosphere to corona Pia Zacharias, Sven Bingert, Hardi Peter Solar Cycle 24 Napa, California December 11, 2008
10 105 K 6.5105 K 5 0 Peter (1999) ApJ 516, 490 Dopplershift [ km/s ] 5 10 SUMER Doppler shifts in the solar transitionregionand in thecorona
3D simulation – Doppler shifts Observation Simulation Probably OK for TR (some 105 K) Not yet good forcoronallines
Fromobservation to simulation • Input magneticfield - quietSun-like • 3D MHD model of coronal box (50x50x30Mm3=2563) (Bingert at al.) • includingradiativeloss, heatconduction and Ohmicheatingdue to fluxbraiding • Spectralsynthesis (CHIANTI) Resultingloopstructures Initial verticalmagneticfield at bottomboundary Evolving TR loops (snapshop)
Doppler velocities in thesimulation CIV (1548 Å) Doppler map Distribution of Doppler velocities (smaller FWHM thanobserved; 3x) <vD>=1.52 km/s meanredshift blueshiftredshift
Global massbalance: constantcoronalmass • Coronalmassfluctuates ≈ 0.1% • Emptycoronaoversimulation time (30 min) wouldneedaverageflow of ≈ max 0.1 km/s • Global sinking of atmospheredue to masslossisNOTresponsiblefornetlineshift N: Number of particles in the box with T>104.1 K <N>: meannumber of particles in the box with T>104.1 K
Investigation of individualloops: hotloops • 1st step: restrain to L > 30 Mm andTmax > 105 K • Assignthesamefieldlines at eachtimestep followfieldlinesthroughthe 30 minute time series snapshot
Nature of theflows in hot and longloops log(T[K])>105 & L>30 Mm Contradiction: Whyisthecoronalmassconstantwhiledownflowsdominate ? Solution ? Coronalmasssupply throughtheheating of cool loops? 27 % 62 % 10 % Siphon flows: Flowthroughtheloop Draining / downflows Flow out of theloop Strange flowprofiles
Heatingloopswithupflows? heating Problem: Even loopsthatareheated up aredraining... Whereareloopswhichfill due to increasingheatinput ? Probablyselectioneffect (T>105K) ? downflow NO hot loopswithupflowsfound!
Outlook • Properlyfollowfieldlines in time • Whatabouttheupflowswesee in the Doppler maps? • Investigate “cool“ loops (T<105 K) withsamelengths