Productivity
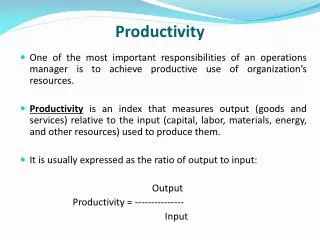
Productivity. Ratio of the amount of goods and services produced (output) per unit of productive resources used (input). As a ratio, productivity can be increased by: producing more goods and services with the same amount of resources or

Productivity
E N D
Presentation Transcript
Productivity Ratio of the amount of goods and services produced (output) per unit of productive resources used (input). As a ratio, productivitycan be increased by: • producing more goods and services with the same amount of resources or • by producing the same amount of goods and services with fewer resources.
Productivity Personal and national standards of living are directly related to labor productivity. • The greater an individual’s labor productivity, the higher wage that individual can command. • People must produce more per person if they are to receive more per person. Individual workers can increase productivity by investing in education and training (human capital).
Participate in a simulation that will demonstrate: • How productivity is calculated • The factors that can increase productivity Work in teams of four to produce pizzas (made of paper).
How to make a pizza: • Trace the template (a small paper plate) on a piece of 8.5″ x 11″ paper. • Cut out the circle. • Draw 10 pepperoni pieces, about 1″ in diameter, on the pizza, using the red marker. • Draw 15 black olive slices, ½″ to ¾″ in diameter, on the pizza, using the black marker.
Each round will be three minutes long. • At the end of each round, quality control experts will determine if pizzas meet standards. • Complete the data chart (Activity 8.1). • Round 1: • Each employee will work alone. • Employees must complete one pizza before moving on to the next.
Thoughts on how to improve productivity? Round 2: • Assign each employee a different task. • You may work on more than one pizza at a time. • You are limited to the same resources as in Round 1.
Thoughts on how to improve productivity? Round 3: • Each team may acquire a capital good: a machine that pre-cuts pizza dough (paper plates). • Machine rental is $2.50 per round. • Reorganize the factory.
How was productivity calculated? Labor productivity = output per worker over a set time • What happened to productivity between Round 1 and Round 2, and between Round 2 and Round 3? Why did this occur? • What happened to quality between Round 2 and Round 3? • What effect did investing in capital goods (the pizza-cutting machine) have on productivity? • What effect did increased productivity have on average costs (row 10, Activity 8.1)? Why is this important?
What effect will increased productivity in the pizza factory have on wages? • What happens if labor productivity increases in the overall economy? • What costs were incurred by attempts to increase productivity? • What are the advantages and disadvantages of specialization and division of labor? • What else could the pizza factory do to increase productivity? • What should a company consider before investing in capital, such as the pizza-cutting machine?
Factors That Increased Productivity • Specialization/division of labor • Assigning small, repeatable tasks at which workers gain expertise, as in Round 2 • Results in more output per unit of labor • Increase in human capital • Acquired through education/training, displayed in all three rounds • Investment in capital goods • Tools/machines/factories as in Round 3 • Technology
U.S. Labor Productivity http://research.stlouisfed.org/fred2/series/OPHNFB