New Data, Efficiency and Background Models
New Data, Efficiency and Background Models. Omit tips & boundaries. ~ 518K events L>0.93. LnL = -1564843.8, NDF 37953 c 2 /NDF = 1.135. Data – Larger Sample. ~ 2M events L>0.70. LnL=-7708417.7, NDF 104598 c 2 /NDF = 1.09. Next. Make sure the isobar model fits work first !

New Data, Efficiency and Background Models
E N D
Presentation Transcript
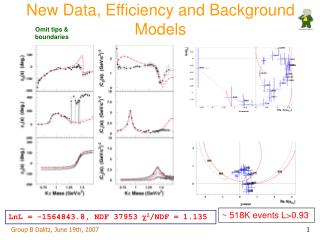
New Data, Efficiency and Background Models Omit tips & boundaries ~ 518K events L>0.93 LnL = -1564843.8, NDF 37953 c2/NDF = 1.135
Data – Larger Sample ~ 2M events L>0.70 LnL=-7708417.7, NDF 104598 c2/NDF = 1.09
Next • Make sure the isobar model fits work first ! • Include I=2 (p+p+) amplitude • Allow P-wave magnitudes to float below Kh threshold? • Input LASS P-wave • Other ideas ?
Data come from: p+p p+ p+ n (12.5 GeV/c) Hoogland et al, Nucl. Phys. B69, 266 (1974) p-d p- p- p ps (9 GeV/c) Durusov et al, Phys. Lett. B45, 517 (1973) (Re-)Fit to form: d02 = -aq / (bm2+cm4+dm6) Achasov and Shestakov, Phys. Rev. D67, 114018 (2003) Then assume amplitude is unitary up to rr threshold: A2= ei d02 sin d02 I=2 p+p+ Amplitude
Data – Isobar Model Fitk, K0(1430), K1(1410), K1(1688), K2(1420) All K* states (+ k!) Best isobar model fit ~ 2M events L>0.70 LnL=-8114132.0, NDF 108158 c2/NDF = 1.137
Data – Isobar Model Fitk, K0(1430), K1(1410), K1(1688), K2(1420) No K1*(1410) 2nd best isobar model fit ~ 2M events L>0.70 LnL=-8112686.3, NDF 108160 c2/NDF = 1.152
Data – Isobar Model Fitk, K0(1430), K1(1410), K1(1688), K2(1420) No K2*(1420) Worst isobar model fit ~ 2M events L>0.70 LnL=-8105548.8, NDF 108160 c2/NDF = 1.229
Data – Isobar Model Fitk, K0(1430), K1(1410), K1(1688), K2(1420) Include I = 2p+p+ Equal to best isobar model fit ~ 2M events L>0.70 LnL=-8114132.0, NDF 108160 c2/NDF = 1.137
P-Wave Magnitude • It is necessary to define a reference phase everywhere in the Dalitz plot • Define P-wave phase as that appropriate for the K*(890) Breit-Wigner from threshold up to Kh threshold. • The cross channel just overlaps this range • It is also necessary to define a magnitude scale. • Set this to 1.0 at the K*(890) pole. • It is not necessary to fix the magnitudes to follow the K*(890) Breit-Wigner
Data – Float P-wave Magnitudes ~ 2M events L>0.70 LnL=-7708543.2, NDF 104590 c2/NDF = 1.088