Download
1 / 5
50 likes | 218 Vues
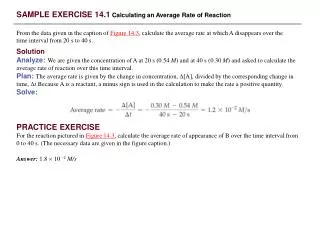
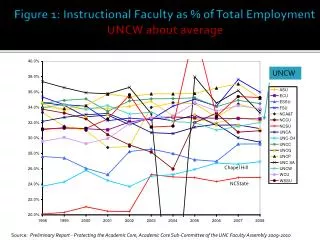
Figure 1: Instructional Faculty as % of Total Employment UNCW about average . UNCW. Chapel Hill. NCState. Source : Preliminary Report - Protecting the Academic Core, Academic Core Sub-Committee of the UNC Faculty Assembly 2009-2010.

E N D
Figure 1: Instructional Faculty as % of Total EmploymentUNCW about average UNCW Chapel Hill NCState Source: Preliminary Report - Protecting the Academic Core, Academic Core Sub-Committee of the UNC Faculty Assembly 2009-2010
Figure 2: Instructional Square Feet per StudentUNCW one of the lowest in System UNCW Source: Preliminary Report - Protecting the Academic Core, Academic Core Sub-Committee of the UNC Faculty Assembly 2009-2010
Figure 3: Mgt/Admin Support Staff to Total FacultyUNCW much higher than comparable universities Median = 0.506 *peer university to UNCW, IPEDS, 2009 data
Figure 4: Mgt/Admin Asst to Total EnrollmentUNCW much higher than comparable universities Median=0.0295 *peer university to UNCW, IPEDS data, 2009
Figure 5: Instructional Expenses to Tuition & State AppropriationsUNCW much lower than comparable universities Median = 0.630; UNC schools = 0.565 Source: IPEDS 2009 data