Download
1 / 12
120 likes | 237 Vues
Join us for an exciting on-campus project exploring stellar spectral classification. Learn about different spectral types (O, B, A, F, G, K, M) and their subtypes using spectrographs to analyze stars. Discover how absorption lines can reveal a star's composition and how blackbody curves indicate temperature. In the lab, you'll identify spectral lines, classify various spectra, and provide reasoning for your classifications based on observed data. Don’t miss the chance to deepen your understanding of stellar properties!

E N D
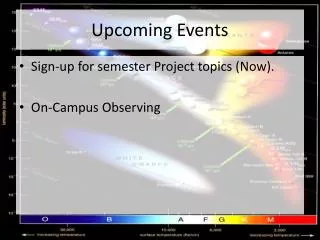
Upcoming Events • Sign-up for semester Project topics (Now). • On-Campus Observing
Stellar Spectral Classification Tiffany Pewett pewett@chara.gsu.edu
Different Spectral Types O,B,A,F,G,K,M Larger, hotter smaller, cooler Subtypes:0-9 0 is hottest of type, 9 is coolest Ex: B7 & K4
Stellar Spectra • Use a spectrograph to spread starlight into a rainbow. • Absorption lines show what the star is made of! • Blackbody Curve can show us the temperature(=spectral type)
To Complete the Lab • Answer all questions on front page fully. • Classify ALL spectra on back as accurately as you can. • Provide “reasons” for the at least three of the spectra that you classify (not all), using specific spectral lines. • Ex: He I, Halpha, & CaII lines match between A0 and A5.