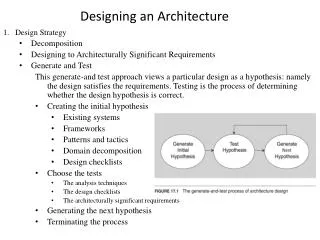
Analyzing an Architecture
Analyzing an Architecture. Why analyze an architecture?. Decide whether it solves the problem Compare to other architectures Assess what needs to change, given some major requirements change Find a problem. Methods. ATAM – Architecture Trade-off Analysis CBAM – Cost Benefit Analysis


Analyzing an Architecture
E N D
Presentation Transcript
Why analyze an architecture? • Decide whether it solves the problem • Compare to other architectures • Assess what needs to change, given some major requirements change • Find a problem
Methods • ATAM – Architecture Trade-off Analysis • CBAM – Cost Benefit Analysis • Architecture Review
ATAM Participants • Evaluation Team • Project Decision Makers • Sponsor, Customer, Management • Architecture Stakeholder • Developers, Users, Testers, etc.
Evaluation Team • Team Leader • Evaluation Leader • Scenario Scribe • Proceedings Scribe • Timekeeper • Process Observer • Process Enforcer • Questioner
Outputs • Concise presentation of the Architecture • Articulation of Business Goals • Quality Requirements – collection of scenarios • Mapping of Architectural decisions to qualities • Identified sensitivity and trade-off points • Set of risks and non-risks • Set of risk themes
Phases of ATAM • 0 - Partnership and Preparation • 1 – Evaluation 1 -- 1 day • 2 TO 3 WEEKS BREAK HERE! • 2 – Evaluation 2 – 2 days • 4 – Follow-up -- 1 week
Evaluation Steps – Phase 1 • 1 - Present the ATAM • 2 - Present Business Drivers • Most important functions • Constraints – technical, economic, political • Business goals • Major stakeholders • Architectural drivers
Evaluation Steps • 3 – Present Architecture (~20 slides; 60 minutes) • 4 – Identify Architectural Approaches • 5 – Quality Attribute Utility Tree
Quality attribute utility tree • Top level: quality attributes • Second level: attribute sub-categories (or, scenario groupings if you think bottom-up) • Third level: quality attribute scenarios • For each scenario, two priority rankings (H/M/L): • Importance • Architect’s estimate of difficulty • See pp 296-297
Evaluation Steps • 6 – Analyze Architectural Approaches • Focus on top priority scenarios first, then 2nd level, … • Understand the architectural decisions made for the scenario, and the consequences • For each architectural decision, generate lists of • Sensitivity points (scenarios influenced by the decision) • Tradeoff points (one scenario helped, another one hurt) • For each sensitivity point and each tradeoff, decide whether it is a risk or non-risk
Sensitivities and tradeoffs: examples • Sensitivities • Configuration files: good for modifiability • Virtual machine: good for portability • Virtual machine: bad for performance • Virtual machine is also a tradeoff point, because it is good for at least one attribute and bad for at least one other
Evaluation Steps – Phase 2 • 7 – Brainstorm and prioritize scenarios • 8 - Analyze Architectural Approaches • 9 – Present Results
CBAM • Goal of CBAM is quantifying decisions • Utility – a measure of value • Cost – to implement a given strategy • Use outputs of ATAM • This is a subjective process!
Scenario • For each scenario of ATAM: • Generate a set of scenarios • The set has a range of responses • The response measure needs to be quantified
Assign Utility Values • This can be hard! • Look at plots in text (pg. 311) • Start by establishing worst-case and best-case limits (0 and 100) • They also tried to find a current and desired value
Priorities • Prioritize the scenarios in order first • The add a weight for each one
Architectural Strategies • Expected value of the response • (Interpolate on the plot) • Effect on other attributes • Cost to implement
Benefit • Bi = Sj(bi,j * Wj) • bi,j expected change in utility with respect to scenario j as a result of using strategy i. • W is weight of scenarios
ROI • R = B / C
Summary • ATAM and CBAM provide structure • CBAM can be hard, since quantification is called for! • Next week we consider a less structured alternative.