Download
1 / 1
10 likes | 190 Vues
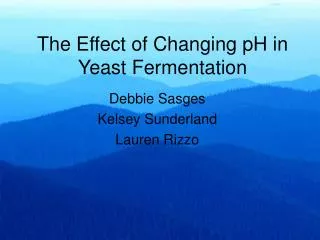
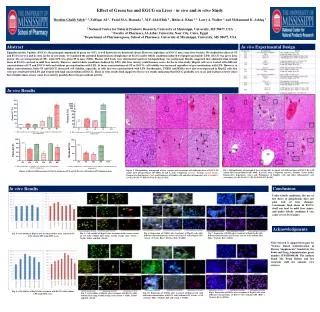
Effect of pH on Tooth Discoloration in Bleached Teeth In-Vitro Joel Richards, Anne L. Hague, RDH, MS, PhD, RD, William M. Johnston, PhD The Ohio State University College of Dentistry, Columbus, USA. ABSTRACT. METHODOLOGY. RESULTS (cont.).

E N D
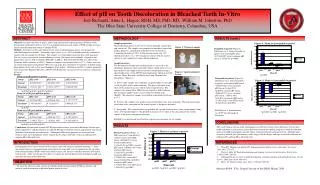
Effect of pH on Tooth Discoloration in Bleached Teeth In-Vitro Joel Richards, Anne L. Hague, RDH, MS, PhD, RD, William M. Johnston, PhD The Ohio State University College of Dentistry, Columbus, USA ABSTRACT METHODOLOGY RESULTS (cont.) Objective: Evaluate the effect of acidic, neutral and alkaline food colorant medium (FCM) on tooth discoloration in bleached teeth in-vitro. It was hypothesized increased acidity of FCM would cause more intrinsic discoloration than neutral or alkaline FCM. Methods: Treatment (n=24) and Control (n=24) sterile, hydrated human molars were prepared in individual, impervious holders. A bleaching agent (Opalescence, 20% carbamide peroxide) remained in contact with each sample for 10 hours. The samples were thoroughly rinsed and their color measured (Pre-test) using a non-contact spectroradiometer system. Specimens were randomly assigned to and immersed in one of 3 buffer solutions (pH2, pH7 or pH12). Red food color (Red40) was added to the Treatment buffer solutions at 0.025%. Immersed samples were incubated 4hrs at 37ºC. Colors were also measured after immersion/incubation (Post-test) and again after subsequent two-minutes of polish using a plain-pumice slurry with a slow-speed handpiece (Post-polish). Differences in CIE a* (redness parameter) were analyzed by Repeated Measures ANOVA with Bonferroni-corrected t-tests for pairwise comparisons of interest. Sample preparation: Extracted human molars (n=48) were stored in formalin, rinsed clean and autoclaved. The samples were prepared in individual, impervious holders (Figure 1) and hydrated in distilled water for four days. Carbamide peroxide gel (20%) with potassium nitrate and .11% fluoride ion (Opalescence PF) remained in contact with the enamel surface of each sample for 10 hours during hydration. Sample measures: The International Commission on Illumination a* was used as the chromacity parameter since it describes redness. Tooth color (a*) was measured for each sample at pretest, posttest and postpolish using a spectroradiometer system: PR705 spectroradiometer, Spectrawin 2.0® software (Photo Research) and Xenon Arc Lamp (Thermo Oriel Instruments) (Figure 2). A. Pretest: The samples were randomly assigned to pH 2 (n=16), pH7 (n=16) or pH12 (n=16) buffer solutions. The pretest measures were taken of the enamel in an area void of surface imperfections. The samples were immersed in 100ml of each respective buffer solution. The treatment samples (n=24) received 25ul of red food color (Red40). The immersed samples were held in an incubator four hours at 37ºC. Figure 4: Mean Δa*post-polish to pretest Figure 1: Prepared samples Postpolish to pretest (Figure 4): Differences in a* from post-polish to pretest were control pH2 (mean -0.074±0.205) versus treatment pH2 (mean 1.487±0.95) (p=0.002). a a Figure 2: Spectroradiometer System Results: ap=0.002 Mean Δa*(±SD) posttest to pretest Post-polish to posttest (Figure 5): Differences in a* frompost-polish to posttestwere control pH2 (mean -0.055±0.166) versus treatment pH2 (mean-2.846±1.522) (p=0.001), control pH7 (mean -0.001±0.171) versus treatment pH7 (mean -1.658±1.863) (p<0.001), treatments pH2 (mean -2.846±1.522) versus pH12 (mean -0.382±0.418) (p<0.001). Reliability of a* determinations was 0.037 (pooled standard deviation). Figure 5: Mean Δa*post-polish to posttest a b c ap<0.001,bp<0.001,cp<0.001,dp<0.001 b Mean Δa*(±SD) post-polish to pretest a,c B. Posttest: The samples were gently rinsed with distilled water after incubation. The posttest measures were taken at the same point on the enamel surface as the pretest measures. C. Post-polish: The enamel surface was polished for a period of two minutes using a plain-pumice slurry with a slow-speed handpiece. The postpolish measures were taken at the same point on the enamel surface as the pretest and posttest measures. Reliability was determined based on three separate measurements for six samples. ap=0.002 Mean Δa*(±SD) post-polish to posttest ap=0.001, bp<0.001, cp<0.001 CONCLUSIONS ap=0.001,bp<0.001,cp<0.001 RESULTS The results indicate that an acidic food pigment caused both extrinsic (mean difference between post-polish and posttest) and intrinsic (mean difference between post-polish and pretest) tooth discoloration and a neutral pH food pigment caused extrinsic tooth discoloration in bleached teeth. Although more research is needed, these preliminary results suggest that the degree and type of tooth discoloration are influenced by ambient pH in bleached teeth. Conclusions:Discoloration in neutral FCM represented extrinsic stain (mean difference between post-polish and posttest) and discoloration in acidic FCM represented both extrinsic and intrinsic stain (mean difference between post-test and pretest). Although food/beverage pigments are associated with extrinsic stain, these preliminary results suggest that the degree and type of stain are influenced by ambient pH in bleached teeth. Figure 3: Mean Δa* posttest to pretest Posttest to pretest (Figure 3): Differences in a* fromposttest to pretest were control pH2 (mean -0.019±0.221) versus treatment pH2 (mean 4.333±2.448) (p<0.001), control pH7 (mean -0.036±0.189) versus treatment pH7 (mean 1.829±1.897) (p<0.001), treatments pH2 (mean 4.3330±2.448) versus pH12 (mean 0.386±0.536) (p<0.001), treatments pH2 (mean 4.3330±2.448) versus pH7 (mean 1.829±1.897) (p<0.001). a,c,d INTRODUCTION REFERENCES Food pigments have been associated with extrinsic rather than intrinsic tooth discoloration.1,2,3 Since the enamel surface is hypomineralized when exposed to a low pH,4 it was hypothesized that an acidic food colorant medium (FCM) would cause both extrinsic and intrinsic tooth discoloration in bleached teeth in-vitro. Little research has been done to examine the relationship between food pigment, pH and tooth discoloration in bleached teeth. • Chan KC, Hormati AA, Kerber PE. Staining calcified dental tissues with food. J Pros Dent. • 1981;46(2):175-178. • Watts A, Addy M. Tooth discolouration and staining: A review of the literature. British Dent • J. 2001;190(6):309-316. • Sulieman M. An overview of tooth discoloration: extrinsic, intrinsic and internalized stains. Dental • Update. 2005;32(8):463-4,466-8,471. • 4. Moss, SJ. Dental erosion. Inter Dent J. 1998;48:529-539. b,d c a b OBJECTIVE • Evaluate the effect of acidic, neutral and alkaline food colorant medium (FCM) on extrinsic and intrinsic tooth discoloration in bleached human molars in-vitro. ap<0.001, bp<0.001, cp<0.001, dp<0.001 Abstract #2604. 87th General Session of the IADR. Miami, 2009