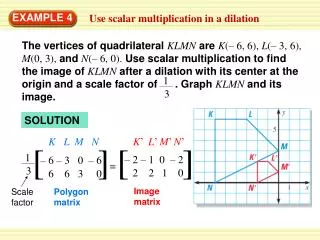
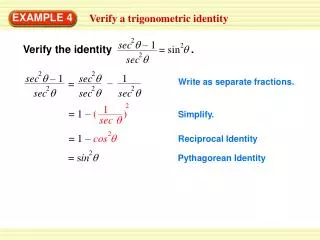
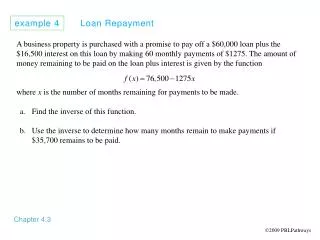
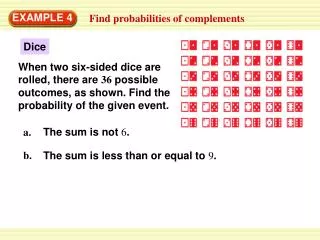
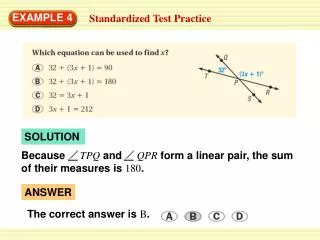
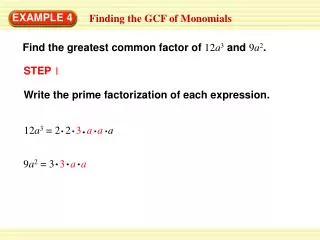
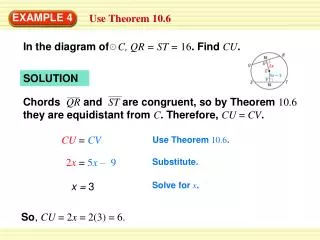
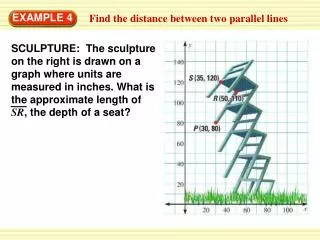
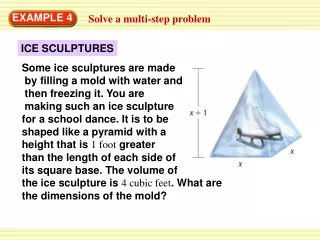
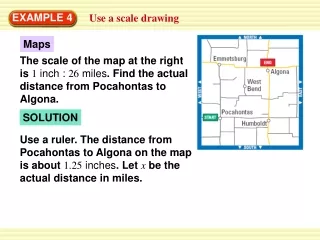
EXAMPLE 4
E N D
Presentation Transcript
EXAMPLE 4 Write an absolute value function Holograms In holography, light from a laser beam is split into two beams, a reference beam and an object beam. Light from the object beam reflects off an object and is recombined with the reference beam to form images on film that can be used to create three-dimensional images. Write an equation for the path of the reference beam.
The vertex of the path of the reference beam is (5, 8). So, the equation has the form y= ax – 5 + 8. Substitute the coordinates of the point (0, 0) into the equation and solve for a. 0= a0– 5 + 8 ANSWER An equation for the path of the reference beam is y = – 1.6 x – 5 + 8. EXAMPLE 4 Write an absolute value function SOLUTION Substitute 0 for yand 0 for x. – 1.6 = a Solve for a.
a.y = 2 f (x) EXAMPLE 5 Apply transformations to a graph The graph of a function y = f (x) is shown. Sketch the graph of the given function. b. y = – f (x + 2) + 1
a . The graph of y = 2 f (x) is the graph of y = f (x) stretched vertically by a factor of 2. (There is no reflection or translation.) To draw the graph, multiply the y-coordinate of each labeled point on the graph of y = f (x) by 2 and connect their images. EXAMPLE 5 Apply transformations to a graph SOLUTION
b . The graph of y = – f (x + 2) +1 is the graph of y = f (x) reflected in thex-axis, then translated left 2 units and up 1 unit. To draw the graph, first reflect the labeled points and connect their images. Then translate and connect these points to form the final image. EXAMPLE 5 Apply transformations to a graph SOLUTION
ANSWER y = – 2| x – 5 | + 4 for Examples 4 and 5 GUIDED PRACTICE 4.WHAT IF?In Example 4, suppose the reference beam originates at (3, 0) and reflects off a mirror at (5, 4). Write an equation for the path of the beam.
5.y = 0.5 f (x) for Examples 4 and 5 GUIDED PRACTICE Use the graph of y = f (x) from Example 5 to graph the given function. SOLUTION
for Examples 4 and 5 GUIDED PRACTICE Use the graph of y = f (x) from Example 5 to graph the given function. 6.y = –f (x – 2 ) – 5 SOLUTION
7. y = 2 f (x + 3) – 1 for Examples 4 and 5 GUIDED PRACTICE Use the graph of y = f (x) from Example 5 to graph the given function. SOLUTION