Download
1 / 27
270 likes | 427 Vues
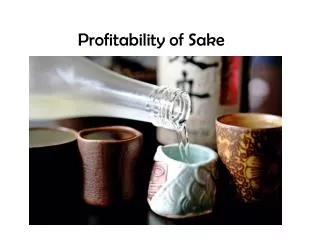
Herring – An alternative to decreasing Baltic cod quotas ? Model-based analysis of the profitability of herring fishery Rainer Klepper Rolf Lasch Institute of Marketanalysis and Agricultural Trade Policy Braunschweig, Germany Content Backround 1996 – 2001 Costs Earnings Inputs

E N D
Herring – An alternative to decreasing Baltic cod quotas ? Model-based analysis of the profitability of herring fishery Rainer KlepperRolf LaschInstitute of Marketanalysis and Agricultural Trade PolicyBraunschweig, Germany
Content • Backround • 1996 – 2001 • Costs • Earnings • Inputs • Model Assumptions • Results • COD – HER • COD-TAC Reduction • Conclusion
Backround • FAIR – Project • TAC (COD) • HER < 15% • Market/Processing • 1996 – 2001 • Model Assumptions • Results • Conclusion
Backround • 1996 – 2001 • Costs • Earnings • Inputs • Model Assumptions • Results • COD – HER • COD-TAC Reduction • Conclusion
Cost Items relative to Returns, 1996 - 2000 100 Returns 100 76 Total costs 73 24 "gross margin" 27 basic model units: kg DM hour trip month 35 Wages & Soc.Ins. 36 20 Marketing 9 8 Fuel & Lub.oil 11 6 Maint. & Repairs 8 3 Nets & Gears 3 2 Insurance (fix) 2 1 Ice & Conserv. 1 2 Provision 1 0 Travel 0 5 Others 3 0 25 50 75 100
Backround • 1996 – 2001 • Costs • Earnings • Inputs • Model Assumptions • Results • COD – HER • COD-TAC Reduction • Conclusion
Baseline Solution - Assumptions - SIM 2001 • Assumptions (Constraints) • TAC : 212 t COD, HER free / 26.5 m Vessel • seadays : 258 (incl. charging and recharging) • max. days /trip : 6 for COD, 2 for HER • market supply (one trip/month, except JUL) • basic unit (kg, DM, hour, trips, month) • deterministic model • MIP (mixed integer model), days • Objective Function --> MAX ! Gross Margin • (Proceeds – Variable Costs)
Backround • 1996 – 2001 • Costs • Earnings • Inputs • Model Assumptions • Results • COD – HER • COD-TAC Reduction • Conclusion
Baseline Solution - Results - SIM 2001 • No Herring Catch • Proceeds [tDM] • Gross Margin [tDM] • Seadays • Number of trips • Catch total [t] • Catch composition • COD [%] • FLX [%] • HER [%] • Others[%] absolute 737 276 162 29 336 Catch Proceeds 62 % 79 % 33 % 16 % - - 5 % 5 % relative 100 % 100 % 100 % 100 % 100 %
COD – Quota Reduction / Future Developments • HER 2001 • HER Fish Price + ? % • HER Catch Rate + ? % • HER, COD Fish Price + ? % • HER, COD Catch Rate + ? % • no HER, COD Catch Rate + ? % • no HER, COD Fish Price + ? % • 94 % GM • + 30 % • + 37 % • + 9 % • + 28 % • + 13 %
Backround • 1996 – 2001 • Costs • Earnings • Inputs • Model Assumptions • Results • COD – HER • COD-TAC Reduction • Conclusion
Conclusion • HER no Alternative to COD (26.5 m vessels, active fishery) • additional income is very low • Globefish: „rising prices of small pelagics“ („reduced supply of Atlantic herring“) • further increase in COD prices
Thank youfor your attention Rainer KlepperRolf LaschInstitute of Marketanalysis and Agricultural Trade PolicyBraunschweig, Germany