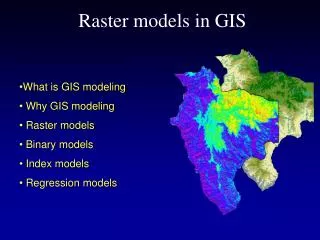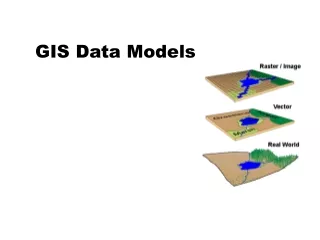
Raster and Vector 2 Major GIS Data Models
Raster and Vector 2 Major GIS Data Models. Data Models: Represent real world in Digital Form. Raster: - divides entire study area into a regular grid of cell in a regular sequence - Each cell = single value

Raster and Vector 2 Major GIS Data Models
E N D
Presentation Transcript
Raster and Vector 2 Major GIS Data Models
Data Models: Represent real world in Digital Form Raster: - divides entire study area into a regular grid of cell in a regular sequence - Each cell = single value - Space filling: every location in study area corresponds to a cell. Shows what occurs everywhere - one set of cells & associated values = layer Vector: - uses discrete line segments or points to identify locations - Objects such streams or boundaries are formed by connecting line segments - Objects do not necessarily fill space. Shows where everything occurs. - one set of points, lines, or polygons = layer
Creating a Raster: A. Features in the “real world” Grid is placed over ‘real world” features The smaller the grid, the more accurate the map & the larger the data storage or file size Each block is a cell B. Each cell is assigned a value Automated methods used to enter data Satellite image such LANDSAT contains 7.4 million cells Raster data can be compressed C. 2 2 2 2 2 2 2 2 2 2 2 2
Classes of Raster Data Values Multiple layers with cell values can be overlayed Can add or subtract layers Resampling may be needed in order to allow cells from different layers coincide. Remote sensing or satellite photos interfaces best with raster since images can be transferred to cell values using automated methods
Conversion between data structures: Vector to Raster Raster to Vector
Topology: Mathematical method used to define spatial relationships between points, lines, and polygons
Topology Use in GIS x, y coordinate or location Adjacency Containment Connectivity
Topology is required to determine spatial relationships in a GIS
With or without Topology: Computer software can NOT see features as humans do: Humans see implicitly In GIS, features must be defined explicitly
Topology uses points, lines, & polygons (0D, 1D, & 2D) to explicitly define spatial relationships Lower dimensional objects build higher dimensional objects: points-> lines-> polygons
Topology Importance: • Spatial Analysis- allows GIS to perform spatial queries. • ie. Point in polygon, buffering , network analysis, polygon overlay • Processing Speed- is faster since relationships are defined • Data Storage- less data is required to be stored; thus allows smaller files • ie. Polygon A & B share same polyline, thus need to store only once
Attributes of GOOD Map Design: Clarity Balance Figure-ground Hierarchical Organization Color Pattern Lettering
Clarity: Point, line, & polygon symbols as well as text must clear & readable Lines- clean, sharp, uniform Shapes- symbols & shading are distinguishable Text- legible
Balance: proper arrangement of component parts of map (title,legend, map body) 3 to 5 ratio pleasing to eye Figure-ground: figure- portion of map that is being portrayed ground- formless area or background
Hierarchical Organization: To show levels of relative importance or comparisons on the map. Can be shown with point, line, or polygon objects
Color: by choosing one hue (one color range) can look at map to distinguish different objects or interpret hierarchy
Patterns: by choosing patterns that are increasing dense patterns, you can look at map and interpret hierarchy (without reading the legend)
Lettering: Text position and orientation rules to follow (Remember these are guidelines; sometimes rules must be broken) Point objects: same font size & positioned horizontally above , below, left, or right Do not split text by other objects Line Objects: text should run parallel to the feature (ie. road or river) if text must follow vertical feature, it is easier to read going up on left (of line) or down on right. Polygon Objects: Text should be within boundary. Text should be horizontal if at all possible. If text must be tilted, curve the text.
Bad Lettering Good Lettering
Components of a Map: Title: Subject matter, date of data, & by what geography North arrow (optional) Map body Legend: explain symbols, color, patterns used. For thematic legends: Legend title = UNITS used, Ascending or descending order Scalebar (optional) Source: Who, what, when Prepared by: who, include date prepared