
Uploaded by
filia
3 SLIDES
152 VUES
30LIKES
Visualizing EIA Sampling Data Trends Across U.S. States (1972-2007)
DESCRIPTION
Dive into the evolution of Environmental Impact Assessment sampling in U.S. states from 1972 to 2007. View the data rates visually with color-coded maps showing progressive changes over time.
Download
1 / 3
Télécharger la présentation 
Visualizing EIA Sampling Data Trends Across U.S. States (1972-2007)
An Image/Link below is provided (as is) to download presentation
Download Policy: Content on the Website is provided to you AS IS for your information and personal use and may not be sold / licensed / shared on other websites without getting consent from its author.
Content is provided to you AS IS for your information and personal use only.
Download presentation by click this link.
While downloading, if for some reason you are not able to download a presentation, the publisher may have deleted the file from their server.
During download, if you can't get a presentation, the file might be deleted by the publisher.
E N D
Presentation Transcript
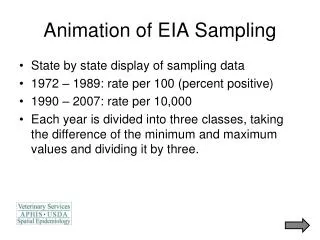
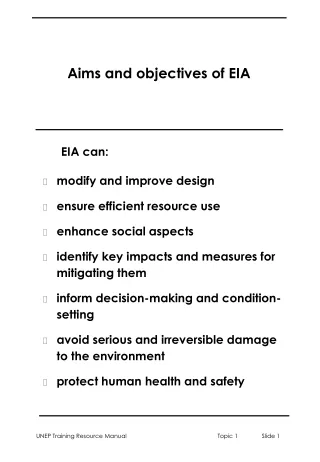
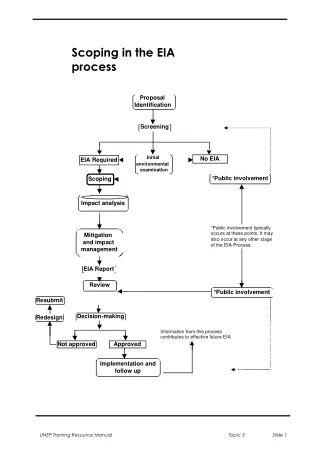
Animation of EIA Sampling • State by state display of sampling data • 1972 – 1989: rate per 100 (percent positive) • 1990 – 2007: rate per 10,000 • Each year is divided into three classes, taking the difference of the minimum and maximum values and dividing it by three.


More Related
Audio
Live Player