Download
1 / 36
530 likes | 1.28k Vues
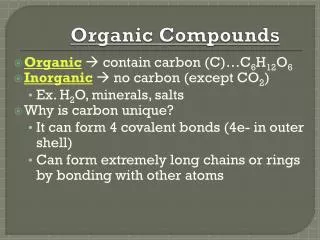
Chiroptic Techniques of Organic Compounds. Professor W. R. Murphy, Jr. Department of Chemistry and Biochemistry Seton Hall University. Chiroptic Techniques. Plane and circularly polarized light Definitions of terms Optical rotary dispersion Circular dichroism. Types of polarized light.

E N D
Chiroptic Techniques of Organic Compounds Professor W. R. Murphy, Jr. Department of Chemistry and Biochemistry Seton Hall University
Chiroptic Techniques • Plane and circularly polarized light • Definitions of terms • Optical rotary dispersion • Circular dichroism
Types of polarized light • Plane polarized light consists two circularly polarized components of equal intensity • Two circularly polarized components are like left- and right-handed springs • As observed by looking at the source, right-handed circularly polarized light rotates clockwise • Frequency of rotation is related to the frequency of the light
Plane polarized light, con’t. • Can be resolved into its two circularly polarized components • When added together after passing through an optically isotropic medium, plane polarized light results
Optical rotary dispersion • If the refractive indices of the sample for the left and right handed polarized light are different, when the components are recombined, the plane-polarized radiation will be rotated through an angle • nl, nr are the indices of the refraction for left-handed and right-handed polarized light • is in radians per unit length (from )
Optical Rotation • Usually reported as a specific rotation [], measured at a particular T, concentration and (normally 589; the Na D line) • Molar rotation [] = []MW10-2
Optical rotary dispersion • Concentration of an optically active substance, c’, expressed in g cm-1 (as density of a pure substance) • d’ = thickness of the sample in decimeters
Optical rotary dispersion • M = molecular weight of the optically active component • n. b. the 10-2 factor is subject to convention and is not always included in [M]
Optical rotary dispersion • ORD curve is a plot of molar rotation [] or [M] vs • Clockwise rotation is plotted positively; counterclockwise rotation is plotted negatively • n. b. – ORD is based solely on the index of refraction • So-called plain curve is the ORD for a chiral compound that lacks a chromophore • Chiral compounds containing a chromophore can give anomalous, or Cotton effect, curves
Cotton effect • Positive Cotton effect is where the peak is at a higher wavelength than the trough • Negative Cotton effect is the opposite • Optically pure enantiomers always display opposite Cotton effect ORD curves of identical magnitude • Zero crossover point between the peak and the trough closely corresponds to the normal UV max
Circular dichroism • Measurement of how an optically active compound absorbs right- and left-handed circularly polarized light • All optically active compounds ex-hibit CD in the region of the appropriate absorption band • CD is plotted as l-r vs • For CD, the resulting transmitted radiation is not plane-polarized but elliptically polarized
Circular dichroism • is therefore the angle between the initial plane of polarization and the major axis of the ellipse of the resultant transmitted light • A quantity is defined such thattan is the ratio of the major and minor axis of the ellipse of the transmitted light • ’ approximates the ellipticity • When expressed in degrees, ’ can be converted to a specific ellipticity [] or a molar ellipticity [] • CD is usually plotted as []
ORD and CD • CD plots are Gaussian rather than S-shaped. • Positive or negative deflections depend on the sign of or [] and corresponds to the sign of the Cotton effect • Maximum of the CD occurs at the absorption max • Where more than one overlapping Cotton effect, the CD may be easier to interpret than the ORD with overlapping S-shaped bands
Origin of ORD-CD peaks • Chromophores in inherently asymmetrical environments such as helical molecules where chromophore is part of the helix • Chromophore near a chiral center (common) • Chromophore adjacent to a chiral plane or axis (less common)
Carbonyl compounds • Most important application of ORD-CD data for organics • C=O has a weak for the n* transition ca 280 nm, but it can be easily observed by ORD-CD on dilute samples (10-2–10-6 M) • Semiempirical rules have been developed to allow conclusions to be drawn about C=O location, ring conformational properties and absolute stereochemistry • The constitution, conformation or configuration can be determined if two of these three things are known
Octant rule • Used to translate the sign of a C=O Cotton effect peak into a conclusion about molecular structure • Trisect carbonyl with three intersecting mutually perpen-dicular planes • Align C=O along z-axis
Octant rule • Substituents in the back lower right and back upper left octants make a positive contribution • Substituents in the back lower left and back upper right octants make a negative contribution • Substituents lying in any of the planes dividing the octants make no contribution
Interpretation • tran-10-methyl-3-decalone 11a has a positive Cotton effect • Looking down the O=C • four carbons in back upper left • one carbon in back upper right • 4 – 1 = +3, so net positive Cotton effect • cis-10-methyl-3-decalone 11b has just the opposite distribution so a negative Cotton effect results • A second conformation yields a weak positive or zero Cotton effect
Interpretation, con’t. • Spectra indicates that trans 11a can be assigned to the positive spectrum • cis 11b with H5 equatorial relative to ring B can be assigned to the weak negative Cotton effect curve
Isomeric ketones • Cotton effect sign will vary even when no differences are observed for the UV C=O n* transition • In next slide, the UV max is 290 nm for all three isomeric chiral ketones, yet the ORD for each is clearly distinguishable
Absolute stereochemistry • Correlating a Cotton effect sign to an octant model to determine absolute configuration assuming relative stereochemistry is known • Comparing two compounds with a similar chromophore environment to determine absolute configuration of one compound based on that known for the second compound
Example of Method 1 • cis(-)-3-methyl-4-t-butylcyclo-hexanone • Exhibits negative Cotton effect • t-butyl group must be equatorial so that the proper octant rule model places the methyl in the back upper right quadrant (vide infra)
Example of method 2 • Steroid 16 has the absolute stereochemistry show in Figure 9.9 • Displays a positive Cotton effect • This is used to assign the absolute stereochemistry for the AB rings in the triterpene cafestrol 17 • Multistep degradation of 17 yields 18 • 18 has a negative Cotton effect, therefore 17 and 18 must have enantiomeric configurations for the A/B substituents
Further notes and caveats • Note that the octant rule works best for molecules with reduced conformational mobility • Modified octant and sector rules have been developed • Helicity rules have also been developed for helicenes • Theoretical calculations work, but are practically difficult due to the need for rigor
Exciton chirality method • CD spectra usually result from one chromophore in the molecule interacting with the light • Interaction with chromophores of other molecules is assumed to be neglible • If two UV chromophores are present in one molecule, exciton coupling is observed
Exciton coupling • Excited state becomes delocalized over two or more chromophores • Excited state splits into two or more states (exciton or Davydov splitting) resulting in two bands • Excitation to the two levels generates Cotton effects of mutually opposite sign • CD spectrum shows two bands of opposite sign, and the maximum and minimum are separated by , the Davydov splitting
Exciton splitting, con’t • Sign of the 1st (greater ) and 2nd (smaller ) Cotton effects can be used to determine the spatial disposition of the chromophores
References • “Organic Structure Analysis” P. Crews, J. Rodríguez, M. Jaspars, Oxford, 1998, New York. • “Physical Methods for Chemists”, R. S. Drago, Surfside, 1992, Boca Raton, FL. • “Organic Structure Determination” D. J. Pasto and C. R. Johnson, Prentice-Hall, 1969, Englewood Cliffs, NJ