PORTFOLIO ANALYSIS
PORTFOLIO ANALYSIS. MODELS TOOLS PRESCRIPTIONS & STRATEGIES. PORTFOLIO MODELS. A multidivisional firm has the problem of how to allocate resources and to back winners in their ‘portfolio’. Certain Portfolio models are linked with: The Product Life Cycle concept


PORTFOLIO ANALYSIS
E N D
Presentation Transcript
PORTFOLIO ANALYSIS MODELS TOOLS PRESCRIPTIONS & STRATEGIES
PORTFOLIO MODELS • A multidivisional firm has the problem of how to allocate resources and to back winners in their ‘portfolio’. • Certain Portfolio models are linked with: • The Product Life Cycle concept • The Experience Curve Concept • The PIMS Study
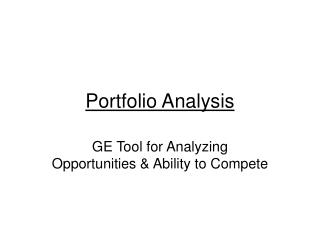
PORTFOLIO ANALYSIS • Portfolio Models can be used to provide strategic insights by: • Acting as a diagnostic aid • Providing a conceptual framework • Being a prescriptive guide • Being a planning tool
PORTFOLIO ANALYSIS THE BOSTON CONSULTANCY GROUP MATRIX
THE BCG MATRIX The BCG Matrix is called the Growth Share Matrix because the model combines market growth and relative market share
MARKET GROWTH RATE • “High Growth” businesses are in markets growing faster than economy • “Low growth” businesses are in markets growing slower than economy
Assumptions under which the Matrix is based • Cash Generated is proportional to Relative Market Share • Cash is needed to keep pace with market growth rate • Additional cash is needed to increase market share • Growth rate eventually slows to allow cash to be generated
BCG GROWTH SHARE MATRIX • The model is drawn for products or SBUs in the following way: • £ Sales - is represented by the area of a circle • Market share is relative to the firm’s largest competitor • Growth rate of the market is computed after being corrected for inflation • Draw the circle at the points of intersection
BCG GROWTH SHARE MATRIX HIGH STAR QUESTION MARK M A R K E T G R O W T H ? CASH COW DOG LOW RELATIVE MARKET SHARE HIGH LOW
BCG STRATEGY PRESCRIPTIONS • Within the portfolio context there are FOUR basic strategies that can be pursued: • BUILD - a strategy of building market share • HOLD- a strategy of holding share relative to competitors and to market growth rate • HARVEST - a cash out strategy with little or no new investment • QUIT - a strategy of exit or withdrawal
BCG GROWTH SHARE MATRIX HIGH STAR QUESTION MARK M A R K E T G R O W T H Strategies: Build Strategies: Build / Harvest Quit CASH COW DOG Strategies: Hold / Harvest Strategies: Harvest / Quit Build (?) LOW RELATIVE MARKET SHARE HIGH LOW
Introduction Stage Growth Stage Maturity Decline Infants - negative cash flow Stars Question Marks Cash Cows Dogs War Horses Dodos PLC and an Extended Form of Growth-Share Matrix Life Cycle Stage Extended Growth Share Types
BCG Cash Flow Position Chart HIGH STAR QUESTION MARK M A R K E T G R O W T H Modest positive or negative cash flow Large negative cash flow Optimum Cash Flow CASH COW DOG Large positive cash flow Modest positive or negative cash flow LOW RELATIVE MARKET SHARE HIGH LOW
BCG Product Dynamics Portfolio Chart HIGH STAR QUESTION MARK M A R K E T G R O W T H Success Sequence Disaster Sequence CASH COW DOG LOW RELATIVE MARKET SHARE HIGH LOW
USING THE MATRIX • Check for internal balance • Look for trends • Evaluate the competition • Consider factors not captured by the display • Develop possible target portfolios • Check for financial balance
PORTFOLIO BALANCE ? • THE BALANCED PORTFOLIO IS REGARDED AS DESIRABLE - CAN WE HAVE OTHER ‘UN-BALANCED PORTFOLIOS? • TOO MANY STARS ? • TOO MANY CASH COWS ? • TOO MANY QUESTION MARKS ? • TOO MANY DOGS ?
Too Many Stars - (High Growth Oriented Companies) • Problems of cash flow • High marketing investments in high growth markets are a pre-requisite to build or hold market share • NPD costs need to be funded & capitalised • Problems of high growth can be problematical - need for high borrowings
Too Many Question Marks • Negative cash flows can be problematic for development - can be undercapitalised • Question marks can become cash traps • High development costs must be capped • Question marks are costly in management time • Can question marks be ‘turned around’?
Too Many Cash Cows - (Profit Orientated Company) • Excessive cash inflows • Where is the future growth to come from ? • High profitability can be used to fund dividends • How do you plan for fading cash cows ?
Too Many Dogs - A Company in Decline • No growth • Modest cash flows • Where is the future to be • But DOGS can be profitable in the short run • Slow or fast decline in the business fortune
Advantages of the Growth-Share Matrix • Easy of Use - 2x2 matrix • Simple yet powerful constructs • Aids strategic thinking - the theory underpinning the matrix quite straightforward • Psychological issues • Popular and well known in the literature • Widely taught in business schools
WEAKNESSES OF GROWTH- SHARE MATRIX • Assessment of relative long-term attractiveness of business units requires more than just market growth and relative market share • Connection between relative market share and profitability is not as tight as experience curve effect implies. Many firms with small relative market shares are profitable.
WEAKNESSES OF GROWTH- SHARE MATRIX • Four-cell matrix hides fact that many businesses are in “average” growth rate markets and have “average” relative market share positions • Misleading simplification to categorise businesses into just four types • Matrix doesn’t identify which businesses offer best investment opportunities • Being a leader in a slow growth market doesn’t guarantee cash cow status.
BCG BALANCED GROWTH SHARE MATRIX HIGH STAR QUESTION MARK M A R K E T G R O W T H 10 5 2 3 6 CASH COW DOG 4 1 9 8 7 LOW RELATIVE MARKET SHARE HIGH LOW
DIRECTIONAL POLICY MATRIX This model is an alternative to the BCG Matrix, and is based on different criteria. • MARKET ATTRACTIVENESS • BUSINESS STRENGTHS
DPM Cont. The two factors of Market Attractiveness and Business Strengths are COMPOSITE measures of potential opportunities open to the firm and the opportunities that the firm can take by leveraging its internal business strengths or competencies.
Market Size Growth Rate Profit Margin Competition Intensity Seasonality Cyclicalicity Social Impact Regulation Environment Opportunities & Threats Barriers to Exit/Entry Technology & Capital MARKET ATTRACTIVENESS
BUSINESS STRENGTH • Market Share • Core Competencies • Profit Margin vs Competitors • Ability to Match Price/Service • Relative Costs • Knowledge • Technological Ability • Management Caliber
CONSTRUCTING ATTRACTIVENESS/ BUSINESS STRENGTH MATRIX • Quantitative measures of market attractiveness and business strength used to plot each business unit’s position in the matrix • Each business unit appears as a circle. Area of the circle is proportional to size of market. Pie slices within circle reflect business’s market share.
DPM PRESCRIPTIVE STRATEGIES • GROWTH • CUSTODIAL • LEADERSHIP • TRY HARDER • DIVESTMENT • PHASED WITHDRAWAL • DOUBLE OR QUIT
PORTFOLIO MODELS IN USE • CARE WHEN USING SUCH MODELS • MODELS HELP - BUT - REMEMBER THE ASSUMPTIONS • DIFFERENT MODELS CAN OFFER DIFFERING SOLUTIONS • USE YOUR JUDGMENT • THINK OF THE ‘OTHER’ FACTORS
Different models different results Results of a study by Wind, Mahajan and Swire (1983) concluded that when using standardized portfolio models the classification of any business into a specific portfolio position depends on four factors:
Wind, Mahajan and Swire cont. • The operational definition of the dimension used • The rule used to divide a dimension in high or low categories • The weighting of the variables used in constituting the composite dimensions • The specific portfolio model used
Wind et al cont. • The issue here is that different models can offer different strategic solutions as SBUs can be classified in different positions • There may be unintended benefits - different portfolio models give different positions can cause a debate in the strategic process • Cash Cow or Dog ?
Problems with Portfolio Models • Cash Flow vs ROI - which should a company adopt ? • Prescriptions can lead to errors in strategy • Growth Rate and Share may be too simplistic a measure to use for market assessment • No assessment of competitors’ strategies • How does the centre add value?