Download
1 / 41
410 likes | 544 Vues
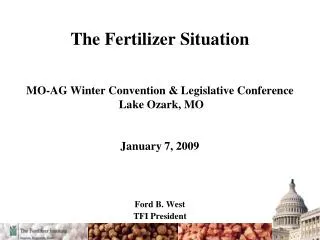
The Fertilizer Situation MO-AG Winter Convention & Legislative Conference Lake Ozark, MO January 7, 2009. Ford B. West TFI President. Average Monthly Wholesale Prices. Source: Green Markets, published by Pike and Fischer. Average Monthly Wholesale Prices.

E N D
The Fertilizer SituationMO-AG Winter Convention & Legislative Conference Lake Ozark, MOJanuary 7, 2009 Ford B. West TFI President
Average Monthly Wholesale Prices. Source: Green Markets, published by Pike and Fischer.
Average Monthly Wholesale Prices. Source: Green Markets, published by Pike and Fischer.
Average Monthly Wholesale Prices. Source: Green Markets, published by Pike and Fischer.
Average Monthly Wholesale Prices. Source: Green Markets, published by Pike and Fischer.
Recap: Factors Resulting in Higher Fertilizer Prices • Dramatic Increase in World Nutrient Demand • More Recently, Rise in U.S. Nutrient Demand • Decline In Domestic N Supply – Natural Gas P’s! • Which resulted in Increased U.S. Imports of Nitrogen • Rising Energy P’s => Higher Production Costs • Rising Raw Material P’s => Higher Production Costs • Tighter supplies of all nutrients! • Increased Shipping/Distribution Costs (ocean freight; rail; barge; truck) • Falling Value of the U.S. Dollar • Curb on food and fertilizer exports by selected countries
What’s Changed? • High Fert P’s and Lower crop P’s => Demand Destruction • Some recovery in the value of the US Dollar • Changing Shipping and Distribution Costs: • Ocean freight rates have very recently collapsed; • Gasoline and diesel fuel prices have declined; but • Rail rates to move ammonia remain high and are expected to continue to climb. • The P’s of some raw material have declined – ammonia & sulfur • We see some of the curbs on food and fertilizer exports by selected countries slowly being removed
Industry Structure * Cost of greenfield in Saskatchewan ** Estimated costs exclude infrastructure outside plant gates (rail, road networks, utility systems, port facilities, etc.) *** Ammonia/urea complex Source: Fertecon, British Sulphur, and PotashCorp.
Phosphate Source: Mosaic
International Sulphur Prices ADNOC – Abu Dhabi National Oil Company – Monthly Posted Price Vancouver - Contract Price Updated November 7th, 2008 July 1, 2008 - $820/tonne Aug 1, 2008 - $770/tonne Sept.1, 2008 - $580/tonne Oct.1, 2008 - $200/tonne Nov.1, 2008 - $40 ? Source: Pentasul
Potash Source: Mosaic.
Over 80% of production exported compared to 12.5% for world grains
Top Fertilizer Importing Countries Share of Share of FY05/06 World Country Rank Country ImportsConsumption (5) France 4.2 % 79 % (4) India 8.0 % 26 % (3) Brazil 9.0 % 68 % (2) China 11.4 % 16 % (1) United States 16.1 % 56 % Top 548.8 % Source: International Fertilizer Industry Association.
Some Observations About the World Grain Market • Production is not keeping up with demand growth • Production has fallen short of use in 7 of the last 9 years • Even with a big increase in production in 2008, stocks are tight • Deficit since 2000 is 220 million metric tons • Demand growth will probably accelerate • More grain used for biofuels production • Income growth leads to improving diets in key developing countries • Especially India and China • World grain stocks have dropped to historically low levels • Stocks are the lowest since the early 1980s • Stocks-to-use ratios are even tighter • Production will need to continue to increase! Source: Doane Advisory Services.
Right Product, Time, Rate and Place Paradigm Right Product RightTime Right Rate Right Place
Right Nutrients Select appropriate nutrients and on farm nutrient sources for the cropping system. Soil Testing N, P, K and micro-nutrient data Enhanced fertilizer efficiency Nutrient management planning
Right Time Application Timing Controlled Release Technologies Inhibitors Fertilizer Product Choice
Right Place Application method Incorporation of fertilizer Buffer strips Conservation tillage Cover cropping
Right Rate Soil testing Yield goal analysis Crop removal balance Nutrient management planning Plant tissue analysis Record keeping Variable rate technologies Site-specific management
N: 42% Improvement: % P: 106% K: 85% Corn Yield: 52% Source: USDA-NASS; PPI
What is Nutrient Use Efficiency? • Crop Recovery Efficiency (RE) = Increase in uptake by the plant per unit nutrient added usually expressed as % • Example: • N uptake when no N applied = 30 lb/A • N uptake when 100 lb applied = 90 lb/A • (90-30)/100 = 60% recovery • System Recovery Efficiency (RE) = output of nutrient in harvested crop as % of inputs • 90/100 =90% recovery • Short- versus long-term?
Conclusions • Ecological intensification is required to increase yields and reduce environmental losses from existing farmland and preserve/protect pristine lands, forests • Increased utilization of nutrient management and conservation practices is possible • Increased demand for all commodities, including biofuels and fertilizer, requires that the products be used as efficiently as possible • Increases in nutrient use efficiency means higher plant uptake, higher yields, less loss to the environment • Risk-reward ratio(s) in current farming practices are very high
19802005Change Bil. Bushels % U.S. corn production 6.40 11.11 + 74 Nutrient Use on Corn Mil. S. Tons % Nitrogen 5.2 5.4 + 3 Phosphate 2.4 2.9 - 20 Potash 2.9 2.2 - 24 Total 10.6 9.6 - 10
USA 1.00 : 0.35 : 0.39 China 1.00 : 0.39 : 0.20 India 1.00 : 0.41 : 0.19
Producers Responding to Lower Demand in Short Run • Capital Costs Remain High • Capital More Difficult to Get Due to Economic Meltdown Plant and Mine Expansions Delayed and/or Scrapped! • Fertilizer Production Cutbacks and Shutdowns: • Nitrogen: • Trinidad, Canada, Russia, Ukraine, Italy, Romania , Estonia, Libya, Turkey, Hungary, Poland, and Germany • Phosphate: • Morocco, Russia, Tunisia, Lithuania, and USA • Potash: • Russia, Germany and Canada
Thank you! www.tfi.org