Download
1 / 18
180 likes | 335 Vues
Liberty Lake Watershed Analysis. Brian E. Drake The University of Texas at Austin. April 24, 2007. CE394K.2 - Hydrology. Outline. Geologic Formation and Background Vegetative Zone of Influence HEC-HMS. Geologic Formation. Creek dammed by ice sheet Lake Missoula flood deposits.

E N D
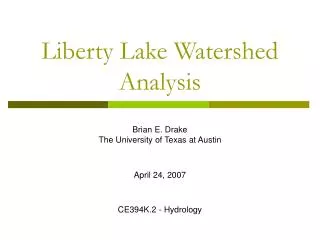
Liberty Lake Watershed Analysis Brian E. Drake The University of Texas at Austin April 24, 2007 CE394K.2 - Hydrology
Outline • Geologic Formation and Background • Vegetative Zone of Influence • HEC-HMS
Geologic Formation • Creek dammed by ice sheet • Lake Missoula flood deposits http://nwcreation.net/articles/missoulaflood.htm
Lake Missoula • Present roughly 12,000 years ago • Covered much of western Montana • Volume = 530 mi3 • Ice Dam = 2500 ft http://www.glaciallakemissoula.org/story.html http://www.pbs.org/wgbh/nova/megaflood/lake.html
http://www.uwsp.edu/geo/projects/geoweb/participants/dutch/VTrips/LkPendOr.HTMhttp://www.uwsp.edu/geo/projects/geoweb/participants/dutch/VTrips/LkPendOr.HTM
The Floods • Likely multiple floods • Peak flow = 386 x 106 cfs • Velocity = 30-50 mph http://www.uwsp.edu/geo/projects/geoweb/participants/dutch/VTrips/Scablands0.HTM http://pirlwww.lpl.arizona.edu/~turtle/photos/PTYS594A_Wash030.html
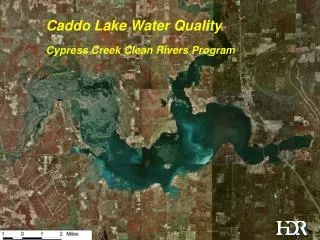
Lake and Watershed Characteristics • Lake = 708 acres • Watershed = 14 mi2 • 15 miles east of Spokane, WA
Outline • Geologic Formation and Background • Vegetative Zone of Influence • HEC-HMS
Motivation • Coupling hydrological/biological processes • Example: Transpiration causing diel streamflow fluctuations • Improve process interactions and water balance accuracy (Bond et al. 2002)
Data Collection • Stilling well • Hourly depth records • Calibrated to flow
Zone of Influence • Transpiration Rates • 2.4 – 330 ft3/acre/hr • Used 120 ft3/acre/hr for computations W
Outline • Geologic Formation and Background • Vegetative Zone of Influence • HEC-HMS
Goals • Gain exposure to HEC-HMS • Define storm capable of causing lake property damage • Adjudicated lake elevation = 2049.51 • Flooding at 2054’
Results to Date 2 yr – 6 hr Storm Peak Flow = 24.4 cfs Volume = 4.9 acre-ft 100 yr – 24 hr Storm Peak Flow = 6376 cfs Volume = 871 acre-ft
Conclusions • Past changes may give insight to future • Diel streamflow fluctuations can be used to quantify vegetative zone of influence • Very dependent on transpiration rates • MODIS Leaf Area Index (LAI) • HEC-HMS is a powerful tool for rainfall-runoff modeling • Still need to determine storage-elevation relationship