Download
1 / 22
220 likes | 384 Vues
Overview of Flood Program April 10 2008. Doug Bellomo, Director Risk Analyses Division Mitigation Directorate, FEMA. Overview. National Flood Insurance Background Why make maps then keep making them The Map Making Process (General) Some Maps and Stats. Overview.

E N D
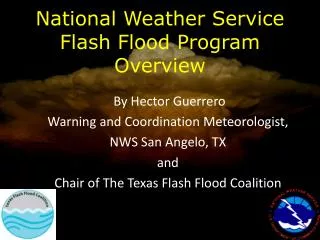
Overview of Flood ProgramApril 10 2008 Doug Bellomo, Director Risk Analyses Division Mitigation Directorate, FEMA
Overview • National Flood Insurance Background • Why make maps then keep making them • The Map Making Process (General) • Some Maps and Stats
Overview • National Flood Insurance Background • Why make maps then keep making them • The Map Making Process (General) • Some Maps and Stats
The Beginning • Before 1968, Federal Government responded with only disaster relief after flood events • The private sector was not covering flood under standard home owners policies • Congress created the program for two primary reasons: • To proactively reduce future flood risk by encouraging sound land use practices • To make flood insurance available to the public
National Flood Insurance How it Works • Federal Government makes flood insurance available • Local government agrees to adopt building standards and floodplain management practices that reduce future flood risk • Federal Government and Local government work together to identify flood hazards – make maps
Overview • National Flood Insurance Background • Why make maps then keep making them • The Map Making Process (General) • Some Maps and Stats
Why make maps? • If you don’t know the size and shape of what you’re up against you can’t manage it • Flood maps bring the hazard out into the open so it can be faced • They are the foundation on which the insurance and floodplain management components (statutory and regulatory) are based
Why keep making maps? • Because the threat and our understanding change with time • Physical changes (natural and man-made) • Statistical Impacts (rainfall records, floods, gage data) • Methodology (models and understanding of water flow) • Because they make people think and the process leads to action
Overview • National Flood Insurance Background • Why make maps then keep making them • The Map Making Process (General) • Some Maps and Stats
Map Making Process • Starts with a Plan a Budget and acronym • Multiyear Flood Hazard Identification Plan – MHIP • Risk informed • Collaborative process with states, locals, and other partners • Moves next to Execution • Scoping map work • Meeting with local governments • Preliminary map released • Draft map issued to community • Due Process – providing opportunity to improve • Appeals • Compliance Period • Effective – Used for floodplain management and insurance • Final production/Gov’t Printing
Tremendous Value in the Process • The maps have a lot of value, but the map making process has just as much • Identifying flood risks and going through process focuses and begins important dialog • Right Conversations – about reducing flood risk • Right People – local officials, individuals, other federal agencies • Right Time – before disaster strikes
1 4 2 Identify Risk Mitigate Risk Assess Risk Map Risk Data • Risk Mapping, Assessment, and Planning (Risk MAP) Life Cycle • Good flood hazard data is the key to Identify Risk Assess Present & Future Risks Risk MAP: REDUCE LOSS OF LIFE & PROPERTY AT LOCAL LEVELS Transfer Risk Goal – Measure Quantifiable Risk Reduction Reduce Risk 3 Communicate Risk Plan for Risk
Overview • National Flood Insurance Background • Why make maps then keep making them • The Map Making Process (General) • Some Maps and Stats
NFIP Status • Over 20,000 communities participate in the program (about 98% of US Population) • Over 100,000 individual map panel • Over 5 million flood insurance policies in force • Over $1 trillion in insurance coverage (exposure)
Progress of Mapping ActivitiesEffective Map Availability DFIRM & FIRM (February 2008)