Analyzing Quality and Efficiency: Customer Returns and On-Time Delivery Metrics
This report examines the correlation between quality performance and internal production efficiency across quarters. It highlights customer returns per quarter versus the total parts shipped, as well as the percentage of purchase orders delivered on time. The analysis also includes data on tooling, molding, and assembly items. By understanding the impacts of internal production efficiency, we can identify opportunities to lower operating costs. The delta figure emphasizes production loss as the gap between machine count and finished goods shipped.

Analyzing Quality and Efficiency: Customer Returns and On-Time Delivery Metrics
E N D
Presentation Transcript
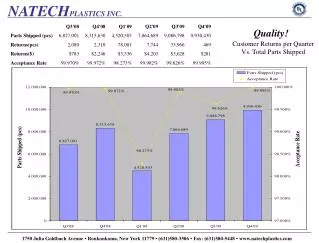
Quality! Customer Returns per Quarter Vs. Total Parts Shipped
On-Time Delivery! Percent of PO’s delivered On-Time by Quarter *Includes tooling, molding, and assembly items
Price! Internal production efficiency per quarter. Greater Efficiency = Lower Cost of Operating = Lower Prices We Can Offer! *Delta is the difference between the machine count, and the finished goods shipped, essentially all production loss.