Auto-Test Intégré des CAN
210 likes | 352 Vues
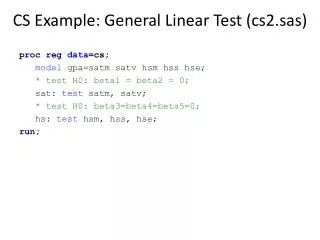
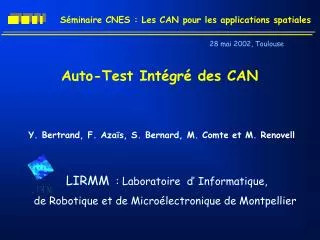
Auto-Test Intégré des CAN. Y. Bertrand, F. Azaïs, S. Bernard, M. Comte et M. Renovell. 28 mai 2002, Toulouse. LIRMM : Laboratoire d’ Informatique, de Robotique et de Microélectronique de Montpellier. Outline. Introduction Histogram-based BIST BIST Implementation Performance Evaluation

Auto-Test Intégré des CAN
E N D
Presentation Transcript
Auto-Test Intégré des CAN Y. Bertrand, F. Azaïs, S. Bernard, M. Comte et M. Renovell Séminaire CNES : Les CAN pour les applications spatiales 28 mai 2002, Toulouse LIRMM : Laboratoire d’ Informatique, de Robotique et de Microélectronique de Montpellier
Outline • Introduction • Histogram-based BIST • BIST Implementation • Performance Evaluation • Conclusions
Specification-Oriented Test ? Introduction Mixed-Signal IC Analog Digital Fault-Oriented Test • ATPG • DFT • BIST
Ideal Transfert Curve Introduction Ideal ADC 111 110 101 100 Digital output 011 LSB = FS/2n 010 001 000 VT1 VT2 VT3 VT4 VT5 VT6 VT7 FS Analog input
111 111 110 110 101 101 100 100 011 011 010 010 001 001 000 000 Introduction ADC Parameters Offset Error Gain Error N-Linearity Errors Ideal Gain 111 110 Offset 101 INL 100 Digital output Digital output Digital output 011 DNL 010 001 000 Analog input Analog input Analog input
111 110 101 100 011 010 001 000 Histogram-based BIST Histogram-based Test output code VT3 FS H(i) Analog input Histogram Time 2A
Control Unit Histogram-based BIST Histogram-based BIST Architecture Digital Output Analog Input n bits ADC Analog Waveform Generator Detector Module 2n Memory Words (Measured Histo.) ADC Parameters DSP or m-Processor 2n Memory Words (Ideal Histo.) Exploitation module
2n Memory Words for the storage of the Ideal Histogram 2 Memory Words for the storage of the Ideal Histogram Histogram-based BIST Choice of the Input Waveform Non-Uniform Distribution Sinusoidal Histogram H(i) Uniform Distribution LinearHistogram Hextreme Hideal
n S S H ( 2 ) H ( 1 ) N2 N2 - H H ( ( i i ) ) Offset = Gain-1 Gain-1 = = 2 × N1 N1 m Codes m.H m.H H H H ideal ideal ideal ideal ideal H ( i ) - = DNL (i) = i S INL (i) = DNL (j) j=1 Addition Addition Addition Subtraction Subtraction Subtraction Division by constant Division by constant Division by constant Histogram-based BIST Parameter Evaluation Code Count H(i) Hextreme Hideal Code i Code 1 Code 2n
Phase 1: Offset Calculation Phase 2: Gain Calculation TIME Phase 3: DNL Calculation Phase 4: INL Calculation Histogram-based BIST Time Decomposition Technique Step 1: Code1Processing Step 2: Code2nProcessing Step 1: CodeN1Processing . . . . . . Step m: CodeN2Processing Step 1: Code1Processing . . . . . . . . Step 2n: Code2nProcessing Step 1: Code1Processing . . . . . . . . Step 2n: Code2nProcessing 1 Memory Word for the storage of the Measured Histogram Reusable test resources
- Control Unit Histogram-based BIST Optimized BIST Architecture Digital Output Analog Input n bits ADC Triangle Wave Generator Detector Module ADC Parameters 1 Memory Word (Measured Histo.) Elementary Operators 2 Memory Words (Ideal Histo.) Exploitation module
- Control Unit Detector Mod. Exploitation module BIST Implementation Optimized BIST Architecture n bits Digital Output ADC Output Detector Module Control Unit 1 Memory Word (Measured Histo.) Elementary Operators 2 Memory Words (Ideal Histo.) Exploitation module
Counter Comparator BIST Implementation Detector Module • Generation of the Reference Code • Comparison of this Code with the ADC Output Control Unit Detector Mod. Exploitation module
ADC_Out [i] ADC_Out [i-1] 1-bit block 1-bit block 1-bit block O2[i-2] O1[i-2] [ i+1] [ i] [ i-1] Number of 1-bit blocks= Nbits BIST Implementation Detector Module ADC_Out [i+1] Control O2[i+1] O1[i+1] Next_Code DM_Set DM_Clear Comparator_Out Control Unit Detector Mod. Exploitation module
H(i) Counter if code = ithenR = R + 1 - H(2n)-H(1) if code = 1 thenR = R + 1 if code = 2nthenR = R + 1 Up/Down Counter 1 m.HIdeal • (P+Z)-bit shift HIdeal = 2P & m = 2Z Up / Down Counter Control Unit Detector Mod Exploitation module BIST Implementation Exploitation module 1 Memory Word (Measured Histo.) Adder Subtractor 2 Memory Words (Ideal Histo.) Divider
1-bit block 1-bit block 1-bit block S2[i-2] S1[i-2] [ i+1] [ i+1] [ i+1] EM_Out[i+1] EM_Out[i] EM_Out[i-1] Number of blocks= F(dGain,dDNL) BIST Implementation Exploitation module c1 c2 S2[i+1] S1[i+1] Ext_Clock EM_Clear Control Unit Detector Mod. Exploitation module
[ i+1] BIST Implementation Control Unit VHDL Library IEEE; use IEEE.std_logic_1164.all entity Contol_Unit is port(ck,startS,endS,In0: in std_logic; c1,c2,clr_DM : Out std_logic); end Control_Unit architecture ArchControl of Control_Unit is type state is (Ini_Etat, o1,o2,o3,o4,o5,o6,o9); signal nextEtat, presEtat: state; begin control : process (presEtat, startS,endS,In0) begin nextEtat <= presEtat case (presEtat) is ... Synopsys Control Unit Detector Mod. Exploitation module
ADC_Out [i] 1-bit block Detector 1-bit block 6 x Nbits [ i] Exploitation 10 x HIdeal=25 & m=24 [ i+1] Control unit VHDL EM_Out[i] Performance Evaluation Example of BIST Structure Number of bits : 6 dDNL = 0.03 LSB dGain= 0.05 LSB Control Unit Detector Mod. Exploitation module
AMS0.8u Area 3.3 mm2 FLASH6 100MS/sec 6 bits BIST 0.22 mm2 6 bits < 7 % Relative area : Performance Evaluation Example of BIST Structure
Fs=10MHz Fs=50MHz Fs=100MHz 30ms 6ms 3ms 500ms 100ms 50ms 7.5s 1.5s 750ms 2mn 24s 12s 32mn 6mn 3mn Trade-off Time-to-area Performances & Discussion Limitation Number of bits TEST TIME Fs=1MHz n 6 300ms 8 5s 10 1mn 15s 12 20mn 14 5h 22mn
Conclusion & Future Integrating Histogram-based Test ? • High Level Structure • Linear Histogram • Simplification of the computations • Time Decomposition • Low Level Implementation • Detector Module = Counter • Exploitation Module = Up/Down Counter • Small Control Unit