Simulating Hawaiian Microclimates
This study explores the annual mean rainfall rates in Hawaii, emphasizing the complex microclimates shaped by the steep mountainous terrain of the Hawaiian islands. By adapting the Weather Research and Forecasting (WRF) model, researchers from IPRC and IASS conducted simulations at 1-km and 3-km resolutions, analyzing the rainfall distribution on Maui. While the 3-km simulation captured major features, it underpredicted rainfall in certain areas. The more refined 1-km model offered improved accuracy, providing valuable insights into the intricate dynamics that define Hawaiian microclimates.

Simulating Hawaiian Microclimates
E N D
Presentation Transcript
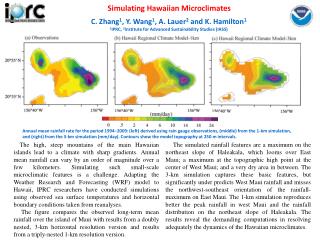
Simulating Hawaiian Microclimates C. Zhang1, Y. Wang1, A. Lauer2 and K. Hamilton1 1IPRC, 2Institute for Advanced Sustainability Studies (IASS) Annual mean rainfall rate for the period 1994−2009: (left) derived using rain gauge observations, (middle) from the 1-km simulation, and (right) from the 3-km simulation (mm/day). Contours show the model topography at 250 m intervals. The high, steep mountains of the main Hawaiian islands lead to a climate with sharp gradients. Annual mean rainfall can vary by an order of magnitude over a few kilometers. Simulating such small-scale microclimatic features is a challenge. Adapting the Weather Research and Forecasting (WRF) model to Hawaii, IPRC researchers have conducted simulations using observed sea surface temperatures and horizontal boundary conditions taken from reanalyses. The figure compares the observed long-term mean rainfall over the island of Maui with results from a doubly nested, 3-km horizontal resolution version and results from a triply-nested 1-km resolution version. The simulated rainfall features are a maximum on the northeast slope of Haleakala, which looms over East Maui; a maximum at the topographic high point at the center of West Maui; and a very dry area in between. The 3-km simulation captures these basic features, but significantly under predicts West Maui rainfall and misses the northwest-southeast orientation of the rainfall-maximum on East Maui. The 1-km simulation reproduces better the peak rainfall in west Maui and the rainfall distribution on the northeast slope of Haleakala. The results reveal the demanding computations in resolving adequately the dynamics of the Hawaiian microclimates.