Download

1 / 42
430 likes | 859 Vues
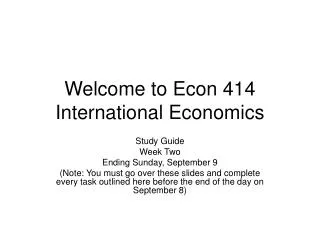
Welcome to Econ 414 International Economics. Study Guide Week Three

E N D
Welcome to Econ 414 International Economics Study Guide Week Three You must complete all tasks outlined here by Friday, September 14. Our first exam is scheduled for Wednesday, September 19 at 2 PM. This is a 50 minutes exam. You will need to go to Thomas 223 at that time to take your exams. Under WebCT’s Discussion, I have listed the topic “Questions on Exam 1”. Post all of your questions on the material covered on exam 1 there.
Assignment 1 • Is graded and mailed to you via WebCT mail. • Answer key is posted is on the homepage of WebCT • Review it carefully as it contains some lessons on • how to determine the comparative advantage • How to determine the mutually beneficial range of terms of trade • how to show that a nation is better off as a result of trade. • How to show that the world is better off as a result of a trade.
beer beer Germany U.S. Exports 2.5 3 2 Imports Imports Exports 0 0 4.5 3 5 computers computers Here is the animated version of Asst 1 Graph • The slope of US PPF (blue line) = 0.5 = opportunity cost of 1 computer = MRT of beer for computer • The slope of German PPF (blue line) = 1 = opportunity cost of 1 computer = MRT of beer to computer • The red lines are the trading possibility curves • The slope of the trading possibility curves = the terms of trade = 3/4.5 or 1/1.5 5 P 5 C B C B P 5 10 4.5
The Terms of Trade • The terms of trade is the relative price of the exportable good expressed in units of the importable good.
The theory of reciprocal demand • In Assignment 1, remember that the range of mutually beneficial terms of trade was • 2 computers >1beer>1 computer • But what affects the actual exact exchange rate within this limit? • The theory of reciprocal demand suggests that: • The stronger the German demand for US computer, the higher the price German’s will pay for US computer, the closer the actual exchange rate will be to 1 beer for 1 computer • The stronger the US demand for German beer, the higher the price US will pay for German beer, the closer the actual exchange rate will be to 1 beer for 2 computer • So the actual exchange rate will depends on how strong the demand of one nation is for the other nation’s product.
beer Price of Computer in terms of forgone beer Supply computers computers Note: Under constant cost assumption (linear PPFs), the supply curve of a good in each country is horizontal. The Price of computer in terms of the number of forgone beer is always constant US US 0.5 5 10
Trade Under Increasing Opportunity Costs • Increasing Costs and the Production Possibilities • The increasing amount of a good that a country must forego to release enough resources to produce each additional unit of another good. • A country may have increasing opportunity costs because: • Factors of production are specialized in the production of a particular product. • For example, highly skilled labor is used in the computer production while low skilled labor is used in the beer production. • Production of different goods use resources in different relative proportions. • For example, the computer industry may require large amounts of capital and the beer industry may require large amounts of labor.
beer Price of computers Supply 5 A B 4.5 C D 2 E F 1 9 10 computers computers Supply Curves of a Good and theProduction Possibilities Frontier Under Increasing Cost Conditions • The opportunity coat of first computer is 0.5 beer. • The opportunity cost of 10th computer is 2 beers. 2 0.5 1 10
Trade Under Increasing Opportunity Costs • Study Figure 2.8 carefully • Notice that the only difference between this and constant cost case is • At any given point on PPF the slope of the tangency line = opportunity cost of the good measured on horizontal axis. • The blue line (the line representing the exchange rate) is tangent to PPF at the production level after trade. • Complete specialization is not possible under increasing cost assumption because if a nation wants to completely specialize in production of a good, its cost of producing that good will be extremely high.
Static/ Dynamic Gains From Trade • Static Gains from trade • Gains in word output that result from specialization and trade are the static gains from trade. • Dynamic gains from trade • Gains from trade over time that occur because trade causes an increase in a country’s economic growth or induces greater efficiency in the use of existing resources.
Chapter 3: The Factor-Proportions Theory (the theory attempts to explain what determines comparative advantage.) • Assumptions of the Factor Proportions Theory • Two countries – U.S. and India producing two goods – machines and cloth • Production and consumption conducted under perfect competition • Firms are price takers. • Prices of factors are determined by supply and demand in each market. • In long run, prices of goods are equal to their respective costs of production.
The Factor-Proportions Theory • No constraints to trade • International trade will not lead to complete specialization. • Consumers in both countries have equal tastes and preferences. • Both countries are endowed with homogeneous factors of production and both are used in production: Capital (K) and Labor (L).
The Factor-Proportions Theory • Technology for production same in both countries and produced under constant returns to scale. • Capital and Labor can flow freely from one industry to the other domestically • Labor and Capital cannot move freely between countries.
The Factor-Proportions Theory • Production techniques available lead to cloth being a labor-intensive good and machines being a capital-intensive good in both countries. • Machines use a lot of capital relative to labor – high K/L ratio. • Cloth uses a lot of labor relative to capital – low K/L ratio.
The Factor-Proportions Theory • The U.S. is relatively capital abundant and India is relatively labor abundant • The K/L ratio is higher in U.S. than in India. • Important: It is the relative quantity of capital to labor that is key.
The Factor-Proportions Theory Table 3.1: Production conditions in the U.S. and India
The Factor-Proportions Theory • Factor Intensity: In a world of two commodities (cloth and machine) and two factors (labor and capital), we say that machine is capital-intensive if the capital-labor ratio (K/L) used in the production of machine is greater than K/L used in the production of cloth.
The Factor-Proportions Theory • Factor Abundance: In a world of two countries (U.S. and India) and two factors (labor and capital), U.S. is capital-abundant compared to India (and India is land-abundant compared to U.S.) if and only if the ratio of the total amount of capital to the total amount of labor (K/L) available in U.S. is greater than that in India.
The Factor-Proportions Theory • The Factor-Proportions Theorem • Assume that U.S. and India have the same tastes: When faced with the same relative price of the two goods, U.S. and India have identical relative demands for machines and cloth. • Assume that both countries have the same technology: A given amount of capital and labor yields the same output of either cloth or machines in the two countries. • The only difference between the countries is in their resources: U.S. has a higher ratio of capital to labor than India does.
The Factor-Proportions Theory • Before trade • Capital less expensive in capital-abundant country – U.S. • Labor less expensive in labor-abundant country - India
The Factor-Proportions Theory • Ratio of payment made to labor, wages and payment made to capital, rent is higher in the U.S. than in India
The Factor-Proportions Theory • Lower opportunity cost to produce goods in the country abundant in the main factor of production • U.S. has lower opportunity cost in production of goods using more capital and less labor. • India has lower opportunity cost in production of goods using more labor and less capital.
The Factor-Proportions Theory • U.S. (capital abundant) has comparative advantage in the production of machines (capital intensive). • India (labor abundant) has comparative advantage in production of cloth (labor intensive).
The Factor-Proportions Theory • Factor-proportions theorem • A country will have a comparative advantage (disadvantage) and export (import) goods whose production intensively uses its relatively abundant (scarce) factor of production.
The Factor-Proportions Theory • The U.S. imports goods from countries where labor in the abundant factor. • The U.S. exports goods that are capital intensive. • Gains from trade are realized when a country exports goods based on its comparative advantage and imports goods based on comparative disadvantage.
Factor-Price Equalization and the Distribution of Income • Moving from autarky to free trade • What happens to an economy’s industrial structure? • What happens to payments/returns to factors of production? • What happens to the distribution of income within the country?
Factor-Price Equalization and the Distribution of Income • Factor-Price Equalization • When trade occurs between countries with different factor proportions, free trade will equalize the price of the goods and cause the relative factor prices to converge. • Convergence of factor prices happens in the long run.
Factor-Price Equalization and the Distribution of Income • Example: U.S. and India • Trade opening up causes prices of machines and cloth to equalize between countries. • Size of machine and cloth industries will change for each country changing their industrial structure. • Industrial Structure – percentage of output accounted for by each industry within a country
Factor-Price Equalization and the Distribution of Income • U.S. has comparative advantage in machines • So it will produce more machines and less cloth • Price of machines relative to cloth will increase in the US. • US will demand more capital to produce more machines and demands less labor to produce cloth • Price of capital (rent) relative to the price of labor (wage) will increase in the US
Factor-Price Equalization and the Distribution of Income • India has comparative advantage in cloth • So it will produce more cloth and less machines • Price of cloth relative to machine will increase in India. • India will demand more labor to produce more cloth and demands less capital to produce machines • Price of labor (wage) relative to the price of capital (wage) will increase in India.
Factor-Price Equalization and the Distribution of Income • Wages • Decline in U.S. • Increase in India • Overall – Prices get closer to equalization • Rents • Increase in U.S. • Decrease in India • Overall - Prices get closer to equalization
Factor-Price Equalization and the Distribution of Income • Trade and the Distribution of Income • Trade produces a convergence of relative prices. • Changes in relative prices have strong effects on the relative earnings of labor and land in both countries: • In U.S., where the relative price of machines rises: • Capitalists are made better off and workers are made worse off. • In India, where the relative price of machines falls, the opposite happens: • Capitalists are made worse off and workers are made better off. • Owners of a country’s abundant factors gain from trade, but owners of a country’s scarce factors lose.
Factor-Price Equalization and the Distribution of Income • Stolper-Samuelson Theorem • International trade will reduce the income of the scarce factor of production and increase the income of the abundant factor of production within a country.
The Specific-Factors Model • Factor proportions theory assumed factors moved quickly between industries. • However, adjustments in capital and labor take time. • Labor will take time to retrain or gain new skills. • Capital will take time to adapt or may not be adaptable at all to another industry. • Attempts to explain what determines comparative advantage.
The Specific-Factors Model • Specific Factor • A factor of production that is specific to an industry or is immobile between industries. • Mobile Factor • A factor of production that can move between industries or is mobile between industries.
The Specific-Factors Model • If the U.S. is well endowed with the specific factor used to produce machines, it will have comparative advantage in production of machines. • Note: I will not ask questions on Figure 3.1 and the related discussion
Empirical Evidence on the Factor-Proportions Theory • The Leontief Paradox • Leontief found that U.S. exports were less capital-intensive than U.S. imports, even though U.S. is the most capital-abundant country in the world.
Empirical Evidence on the Factor-Proportions Theory • Explanations of the Leontief Paradox • Some imports depend on a country’s resources, not just capital and labor • Capital-intensive resource extraction leads to increase of capital-intensive imports • US labor intensive industries are heavily protected. • Decrease of labor intensive imports
Empirical Evidence on the Factor-Proportions Theory • Assumed labor is homogeneous • Labor differs by levels of human capital • U.S. exports not labor intensive but human capital intensive • Technology differs from other factors. • U.S. exports are more technology intensive.
Empirical Evidence on the Factor-Proportions Theory • Factor proportions theory is correct in general. • Needs to consider what a factor of production is • Skilled labor force • Human Capital • Technology • Resources
Empirical Evidence on the Factor-Proportions Theory • International Trade Not Explained by the Factor-Proportions Theory • Natural Resources • A country either has them or not • Diamonds, Oil, Gold, Climate • Intra-Industry Trade (Ch. 4) • Importing and Exporting similar but differentiated goods • Computers, Automobiles, Steel
Summary • The factor-proportions theory is a way to explain why countries have different opportunity costs associated with producing different goods. • The factor-proportions theory suggests that differences in relative factor endowments between countries determine the basis for trade.