Car ownership
350 likes | 590 Vues
Car ownership. Why ?. Market research: if you are a vehicle manufacturer Public policy: how much infrastructure , transport planning , land use planning , obvious essential input to travel demand models , equity , sustainability

Car ownership
E N D
Presentation Transcript
Why? • Market research: if you are a vehiclemanufacturer • Public policy: howmuchinfrastructure, transport planning, land useplanning, obviousessential input to traveldemandmodels, equity, sustainability • Planning on a very high level (national, and regional level), butalso in detailedplanning (block level)
Two different approaches • Time series analysis (eitherveryaggregate, or segmented population) + low data requirements - limitedscope • Disaggretagemodels of householdbehaviour + can be applied for many different research questions - high data requirements
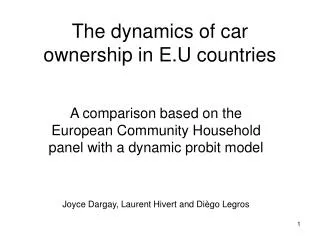
Car ownershipversus GDP per capita26 countries 1960-1992 Dargay and Gately (1999)
Plot! Let’s try a quadraticmodel….
Another improvement • A separate model for segments of the population, in particularcohorts
Gompertzmodel(Dargay and Gately, 2001) Cars per capita
Letuspause • What are the assumptionsbehindtheseprojections?
Letuspause Whataboutattitudinalchange? Whatabouttechnologicalchange? • Alternative fueltypes • Self-driving cars …. • Cars as public transportation
Cars as public transportation? Electronicalcoupling V2V, V2I, I2V Fleet management, systems optimum withinreach Land use: suppose that cars can be parked anywhere Whathappens with land use?
Take-awayscarownership For which policy questionsdoweneed to forecastcarownership? Explain. Time series modelling on aggregate data Which variables have the highestexplanatory power? (whatexplainscarownership?) Whatassumptions are beingmade for forecasting? Compareaggregate time series models with disaggragatemodel of householdbehavior
Travel is deriveddemand … so is alsodeparture time choice Two different views (depending on context) • Preferreddeparture time or • Preferredarrival time (PAT)
Simple SchedulingModel • Schedule DelayEarly (SDE) • Schedule Delay Late (SDL) Slope 2.5 0.5 Slope 0.60 Early Late
Value of travel time Travel time is a number Wemayvalue different aspects, such as Waiting time In-vehicletravel time Butthese are numbers, finite dimensional At the most, a vector It is ”easy” to communicate, ”the value of 1 minuteshortertravel time is 5 SEK”.
Value of travel time reliability What is the value of this? Standard deviation Variance Whataboutskewness?
Simple SchedulingModel • Important for travel time uncertainty Slope 2.5 0.5 Slope 0.60 Early Late
Value of travel time reliability and scheduling It has beenshown that the value of travel time reliabilitycan be captured by standard deviation or variance, in the case of different schedulingmodels Empiricalevidence suggests that there are morethanscheduling: penalty for being late per se, and the tail of the distribution matters
Bottleneck (11.5.3) destination origin
Exercise In the urban road networkduring morning peak hour, is the congestiondue to A. Volume-delayrelationships (rememberassignment) or B. Bottleneck? C. Or is this a trick question?
Take-awaysdeparture time and scheduling Explain a simple schedulingmodel Relation to departure time choice … and valuation of travel time uncertainty Explain the simple bottleneckmodel and it relevance to urban congestion