Download
1 / 20
210 likes | 535 Vues
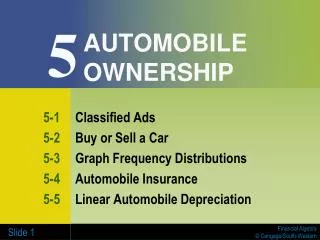
AUTOMOBILE OWNERSHIP. 5. 5-1 Classified Ads 5-2 Buy or Sell a Car 5-3 Graph Frequency Distributions 5-4 Automobile Insurance 5-5 Linear Automobile Depreciation. AUTOMOBILE OWNERSHIP. 5. 5-6 Historical and Exponential Depreciation 5-7 Driving Data 5-8 Driving Safety Data

E N D
AUTOMOBILE OWNERSHIP 5 5-1Classified Ads 5-2Buy or Sell a Car 5-3Graph Frequency Distributions 5-4Automobile Insurance 5-5Linear Automobile Depreciation
AUTOMOBILE OWNERSHIP 5 5-6Historical and Exponential Depreciation 5-7Driving Data 5-8Driving Safety Data 5-9Accident Investigation Data
5-3GRAPH FREQUENCY DISTRIBUTIONS OBJECTIVES Createa frequency distribution from a set of data. Usebox-and-whisker plots and stem-and-leaf plots to display information.
from 5-2 mean outlier ascending order median range quartiles lower quartile upper quartile 5-2 cont. interquartile range (IQR) mode from 5-3 frequency distribution stem-and-leaf plot box-and-whisker plot Key Terms (from 5-2 & 5-3)
Why are graphs used so frequently in mathematics, and in daily life? • Can graphs be used to mislead people?
Example 1 Jerry wants to purchase a car stereo. He found 33 ads for the stereo he wants and arranged the prices in ascending order: $540 $550 $550 $550 $550 $600 $600 $600 $675 $700 $700 $700 $700 $700 $700 $700 $750 $775 $775 $800 $870 $900 $900 $990 $990 $990 $990 $990 $990 $1,000 $1,200 $1,200 $1,200 He is analyzing the prices, but having trouble because there are so many numbers. How can he organize his prices in a helpful format?
Example 1 (cont.) Create a frequency distribution. Add the frequencies to be sure no numbers are left out.
CHECK YOUR UNDERSTANDING Use the frequency distribution from Example 1 to find the number of car stereos selling for less than $800.
Example 2 Find the mean of the car stereos prices from Example 1. • Create a 3rd column to show product of 1st 2 columns. • Find total of 3rd column, divide by total prices
CHECK YOUR UNDERSTANDING Jerry, from Example 1, decides he is not interested in any of the car stereos priced below $650 because they are in poor condition and need too much work. Find the mean of the data set that remains after those prices are removed.
Histogram • A histogram is a graph of frequencies. • Examples: Making Histograms • Put frequencies on vertical axis. • Bars should touch.
Histogram (cont.) • Group numbers into ranges to make data more meaningful
EXAMPLE 3 Rod was doing Internet research on the number of gasoline price changes per year in gas stations in his county. He found the following graph, called a stem-and-leaf plot. What are the mean and the median of this distribution? Note the key
EXAMPLE 3 (cont.) The mean: Add the data and divide by the frequency (the number of leaves). • 1,188 ÷ 30 39.6 The median: The frequency is 30. Since it is even, find the mean of the 15th and 16th positions. • 15th =39; 16th = 39 • median = 39
CHECK YOUR UNDERSTANDING Find the range and the upper and lower quartiles. Range: highest – lowest • 72 – 11 = 61
Quartiles divide the data into 4 equal groups. • Q2, the median, creates 2 groups • Q2 = 39 • Q1is the lower quartile. • Find the median of the data below Q2. • There are 15 numbers in lower group. Q1is in the 8th position, 23. • Q3is the upper quartile. • Find the median of the data above Q2. • There are 15 numbers in the upper group. Q3 is in the 23rd position, 55.
EXAMPLE 4 Rod, from Example 3, found another graph called a box-and-whisker plot, or boxplot. • Plot the minimum, 3 quartiles and maximum on a number line. • Draw a box using Q1 and Q3 at either end. • Draw a line through Q2, the median of all the data. • Find the interquartile range (IQR), Q3 – Q1 • 55 – 23 = 32
CHECK YOUR UNDERSTANDING Based on the box-and-whisker plot from Example 4, what percent of the gas stations had 55 or fewer price changes?
EXAMPLE 5 The following box-and-whisker plot gives the purchase prices of the cars of 114 seniors at West High School. Are any of the car prices outliers?
CHECK YOUR UNDERSTANDING Examine the modified boxplot. Is 400 an outlier?