Correlation & Regression – Non Linear Emphasis
120 likes | 158 Vues
Discover the nuances of non-linear regression models like positive and negative quadratic regression, and exponential regression. Learn to identify non-linear patterns using residual analysis in correlation data. Practice interpreting residual patterns for quadratic and exponential equations.

Correlation & Regression – Non Linear Emphasis
E N D
Presentation Transcript
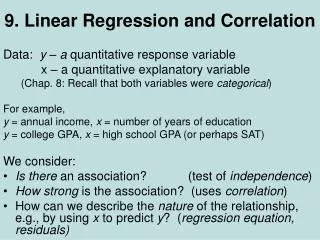
Correlation & Regression – Non Linear Emphasis Section 3.3
Positive Quadratic Regression: Negative Quadratic Regression: Non Linear Regression Shapes……
Positive Exponential Regression: Negative Exponential Regression: Non Linear Regression Shapes……
Quadratic: Exponential: Quadratic and Exponential on Calculator……
What should you look for to tell if it is not linear?...... • Sometimes a high “r” value for linear regression is deceptive. You must look at the scatter plot AND you must look at the residual pattern it makes. • Residuals – positive and negative deviations from the least squares line. Each residual is the difference between the observed y value and the corresponding predicted y value. • If the residuals have a curved pattern then it is NOT linear.
Example……The scatter plot could possibly be linear. You must check the residual pattern.
Change y-list to residsafter running a linear correlation regression – 2nd stat resid: Notice the curved pattern in the residuals. It is either quadratic or exponential.
Equation: This is a quadratic regression…..
There is acurved pattern in the residuals. It is NOT linear – we will see that it is exponential. (Positive) Look at the residuals……
Practice Assignment…… • Worksheet