
SlideServe
Menu
Préférences
© SlideServe · v2026

Linear Regression and Correlation

dusty avatar
5 diapositives · 255 Views · Aug 05, 2014

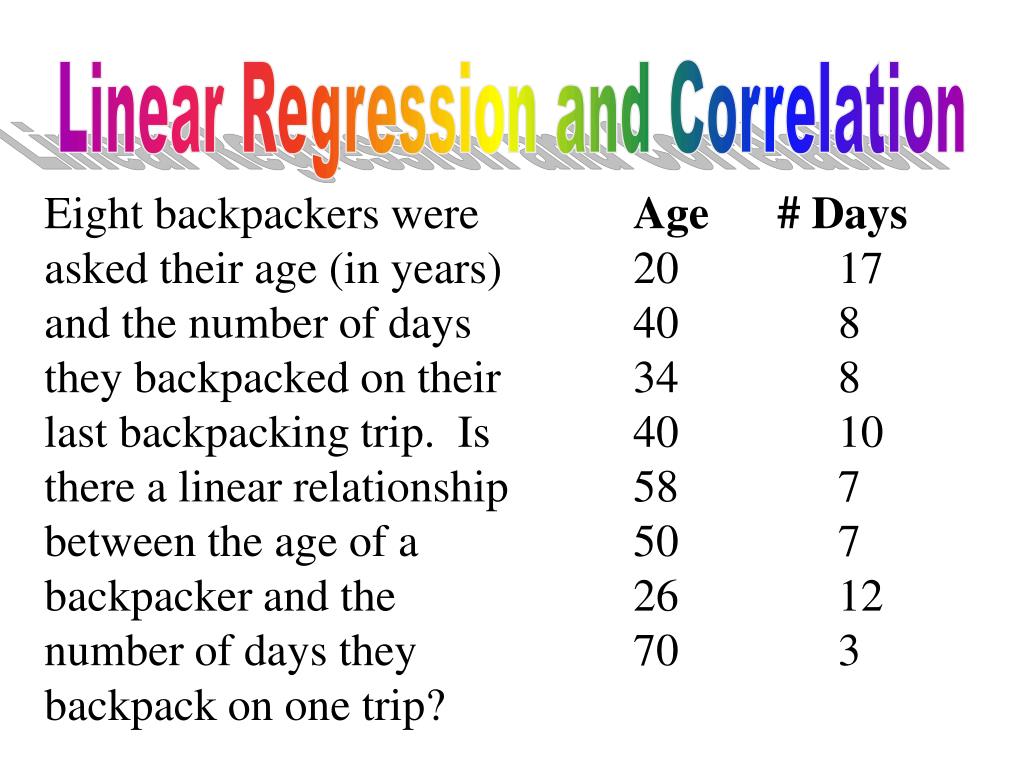
Linear Regression and Correlation. Eight backpackers were asked their age (in years) and the number of days they backpacked on their last backpacking trip. Is there a linear relationship between the age of a backpacker and the number of days they backpack on one trip?. Age # Days 20 17
Linear Regression and Correlation - slide 1
01 / 5Linear Regression and Correlation
1 / 17

Télécharger la présentation

Linear Regression and Correlation
Une image / un lien ci-dessous est fourni (tel quel) pour télécharger la présentation

Politique de téléchargement : le contenu du site vous est fourni TEL QUEL pour votre information et votre usage personnel ; il ne peut être vendu, concédé sous licence ni partagé sur d’autres sites sans l’accord de son auteur.Le contenu vous est fourni TEL QUEL, pour votre information et votre usage personnel uniquement. Téléchargez la présentation en cliquant sur ce lien. Lors du téléchargement, si vous ne parvenez pas à télécharger une présentation, l’éditeur a peut-être supprimé le fichier de son serveur.Pendant le téléchargement, si vous ne parvenez pas à obtenir une présentation, le fichier a peut-être été supprimé par l’éditeur.

F I N

Plus de contenu associé

Transcription de la présentation
  1. Linear Regression and Correlation Eight backpackers were asked their age (in years) and the number of days they backpacked on their last backpacking trip. Is there a linear relationship between the age of a backpacker and the number of days they backpack on one trip? Age # Days 20 17 40 8 34 8 40 10 58 7 50 7 26 12 70 3

  2. Linear Regression and Correlation Age # Days 20 17 40 8 34 8 40 10 58 7 50 7 26 12 70 3 • First, do a scatterplot of the data. • Then do Linear Regression.

  3. Linear Regression and Correlation • Line of Best Fit or Least Squares Line • yhat = a + bx: • yhat = 18.5286 – 0.2255x • Correlation: r = - 0.9011

  4. Linear Regression and Correlation • Is the correlation, r, significant? • Compare r = - 0.9011 to the value in the 95% Critical Values of the Sample Correlation Coefficient Table at the end of chapter 12. • Since n – 2 = 8 – 2 = 6, the table critical value is – 0.707 • Because -0.9011 < -0.707, r is significant. • We will plot the line and use use the line for prediction.

  5. Linear Regression and Correlation • If age of backpacker = 45 years, how many days, on average, would he or she backpack? • If age of backpacker = 32 years, how many days, on average, would he or she backpack? • If age of backpacker = 90 years, how many days, on average, would he or she backpack? • (Reminder: 20  x  70)