Understanding Linear Regression and Correlation through College Freshmen and Football Players Data
120 likes | 263 Vues
This chapter explores linear regression and correlation using examples from college freshmen's math test scores and final calculus grades. We analyze the least squares regression line, represented by the equation y = 40.8 + 0.766x, discussing the significance of predictor coefficients and the ANOVA table. Additionally, it emphasizes measuring the strength of the relationship between variables and interpreting regression results, including the importance of not making unjustified causal claims and the potential for errors in model fitting and extrapolation.

Understanding Linear Regression and Correlation through College Freshmen and Football Players Data
E N D
Presentation Transcript
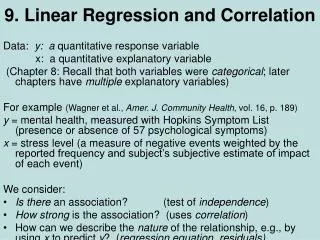
CHAPTER 12 Linear Regression and Correlation
Example The table shows the math achievement test scores for a random sample of n = 10 college freshmen, along with their final calculus grades.
Least squares regression line Regression Analysis: y versus x The regression equation is y = 40.8 + 0.766 x Predictor Coef SE Coef T P Constant 40.784 8.507 4.79 0.001 x 0.7656 0.1750 4.38 0.002 S = 8.70363 R-Sq = 70.5% R-Sq(adj) = 66.8% Analysis of Variance Source DF SS MS F P Regression 1 1450.0 1450.0 19.14 0.002 Residual Error 8 606.0 75.8 Total 9 2056.0 Regression coefficients, a and b Minitab Output
Measuring the Strength of the Relationship • If the independent variable x is useful in predicting y, you will want to know how well the model fits. • The strength of the relationship between x and y can be measured using:
Measuring the Strength of the Relationship • Since Total SS = SSR + SSE, r2 measures • the proportion of the total variation in the responses that can be explained by using the independent variable x in the model. • the percent reduction in the total variation by using the regression equation rather than just using the sample mean y-bar to estimate y.
Interpreting a Significant Regression • Even if you do not reject the null hypothesis that the slope of the line equals 0, it does not necessarily mean that y and x are unrelated. • Type IIerror—falsely declaring that the slope is 0 and that x and y are unrelated. • It may happen that y and x are perfectly related in a nonlinear way.
Some Cautions • You may have fit the wrong model. • Extrapolation—predicting values of y outside the range of the fitted data. • Causality—Do not conclude that x causes y. There may be an unknown variable at work!
Example The table shows the heights (in cm) and weights(in Kg) of n = 10 randomly selected college football players.