Download
1 / 55
550 likes | 562 Vues
Explore the innovative use of morphed microwave imagery for observing tropical cyclones, providing real-time insights into precipitation structures and storm dynamics. Learn about the advantages and limitations of morphing strategies in visualizing meteorological events.

E N D
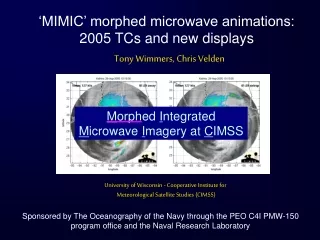
‘MIMIC’ morphed microwave animations: 2005 TCs and new displays Tony Wimmers, Chris Velden Morphed Integrated Microwave Imagery at CIMSS University of Wisconsin - Cooperative Institute for Meteorological Satellite Studies (CIMSS) Sponsored by The Oceanography of the Navy through the PEO C4I PMW-150 program office and the Naval Research Laboratory
85-91 GHz microwave band • 85-91 GHz channels of the: DMSP 13/14/15 SSM/I, DMSP 16 SSMIS, TRMM Thematic Mapping Imager (TMI) and Aqua AMSR-E • Global coverage DMSP SSM/I TRMM TMI Aqua AMSR-E
85-91 GHz microwave band • Signal is strongly attenuated by hydrometeors generated by deep convection, so it can be used as a proxy for precipitation (like radar) • Unique tool for observing eyewall dynamics (such as eyewall formation, replacement cycles, motion of spiral bands delivering vorticity to the eye) DMSP SSM/I TRMM TMI Aqua AMSR-E
Problem: Irregular time gaps in LEO microwave imagery Sept 12 Sept 13 06 08 10 12 14 16 18 20 22 00 02 UTC AMSR-E TRMM TMI SSMI SSMI Example: Hurricane Ivan (2004)
Sept 12 Sept 13 06 08 10 12 14 16 18 20 22 00 2 major visualization problems Irregular time gaps are too difficult to piece together mentally. This is worsened by the fact that most of us think we’re smart enough to do it. AMSR-E TRMM TMI SSMI SSMI
Example: Hurricane Ivan (2004) 10 Sept, 1220 UTC
Example: Hurricane Ivan (2004) 10 Sept, 1829 UTC
Example: Hurricane Ivan (2004) 10 Sept, 2257 UTC
Example: Hurricane Ivan (2004) 11 Sept, 0202 UTC
Example: Hurricane Ivan (2004) 11 Sept, 0537 UTC
Example: Hurricane Ivan (2004) 11 Sept, 0641 UTC
Example: Hurricane Ivan (2004) 11 Sept, 1131 UTC
Morphing strategy 10 Sept, 1829 UTC
Morphing strategy 1) Axially symmetric rotation 10 Sept, 1829 UTC
Morphing strategy 2) ~Holland profile of windspeed (advection) 10 Sept, 1829 UTC
Morphing strategy 3) Advection proportional to reported maximum winds 10 Sept, 1829 UTC
Morphing strategy 3) Advection proportional to reported maximum winds 10 Sept, 1829 UTC
Morphing strategy 4) No advection within ~55 km from the center 10 Sept, 1829 UTC
2 major visualization problems Microwave 2. Intercomparison between images (esp. microwave and infrared) should be easy - that’s the programmer’s job, not the forecaster’s Geo Infrared Radar
Microwave component uses the Polarization Corrected Temperature (PCT) - a proxy for precipitation • The microwave layer is semitransparent • Yellow areas are ‘no data’ ‘MIMIC-IR’: Katrina, 27-29 Aug 2005
Latency issues with LEO microwave and geo IR ~ 2-10 hrs … t t - 8hrs t - 6hrs t - 4hrs t - 2hrs t - 10hrs … 15 min
+3 hrs persistence fx fading out 3 hrs persistence fx Microwave “persistence forecast” (7 hr latency) … t t - 8hrs t - 6hrs t - 4hrs t - 2hrs t - 10hrs … 15 min
2 hrs persistence fx Microwave “persistence forecast” (2 hr latency) … t t - 8hrs t - 6hrs t - 4hrs t - 2hrs t - 10hrs … 15 min
All data 2-hour persistence forecast Persistence forecast: Lessons from 2005 TCs 3-6 hours is the optimal length of a persistence forecast 50% of the time, this strategy yields a well-developed nowcast of the TC precipitation structure
Main conclusion Morphing does not add information to the image sequence from which it is built, but it can make the image sequence incredibly easier to visualize
Easier to interpret than irregularly-spaced image sequences (makes the most of the original imagery) Can be calculated quickly on a desktop computer (on the order of minutes) without an atmospheric model or radiative transfer model Still smoothes out the spatial detail somewhat Not sufficient for capturing transitions in rapidly developing events (cumulus development, rotation inside eyewall) Morphing can be deceptively convincing, even when it’s done wrong Tradeoffs of morphing Advantages Disadvantages
MIMIC-IR website (NEW) • Real time TCs • Product description • FAQ • 2005 archives • http://cimss.ssec.wisc.edu/tropic/real-time/marti/mimic-ir.html, or tinyurl.com/pzxlo For more information: MIMIC website Real time TCs Product description FAQ 2004-2005 archives http://cimss.ssec.wisc.edu/tropic/real-time/marti/marti.html, or tinyurl.com/pec9s
Total Precipitable Water from DMSP-13/14/15 (Cat 4 to Cat 2 in <18 hrs on 09/06)