Download

1 / 0
0 likes | 129 Vues
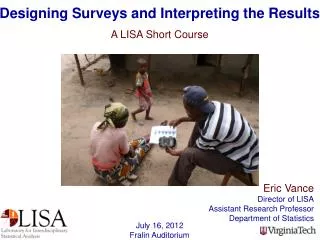
Designing Surveys and Reporting the Results Workshop for Human Rights Researchers and Campaigners AAAS Scientific Responsibility, Human Rights and Law Program. Eric Vance Director of LISA Assistant Research Professor Department of Statistics. June 8, 2012 Washington, DC.

E N D