Download
1 / 75
750 likes | 753 Vues
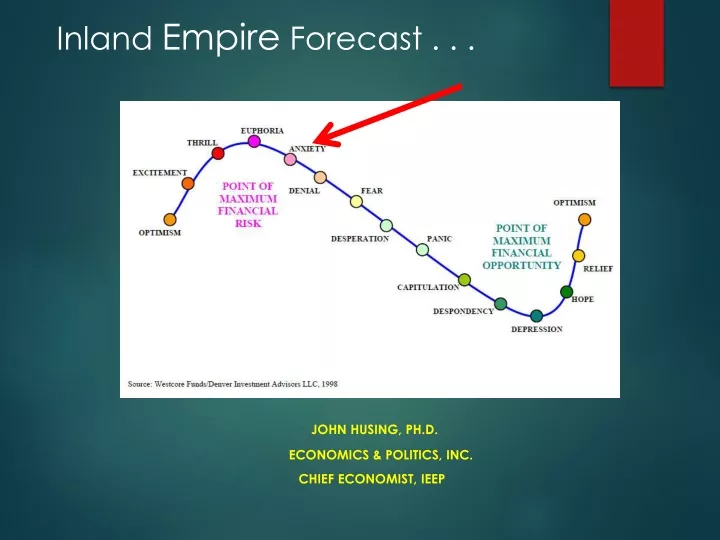
This economic forecast for the Inland Empire region analyzes job growth, population trends, and housing market dynamics. It highlights the impact of various sectors and provides insights into the potential risks and opportunities.

E N D
Inland Empire Forecast . . . John Husing, Ph.D. Economics & Politics, Inc. Chief Economist, IEEP
17.9% Add Potential Workers: Given Up Or Part Time 10.1% 7.5% 3.9%
Inflation Worry 3.6% 1.9%
Interest Rates: 2 Short Term Rate Increases 4.48% 2.69%
Yield Curve: Potential Recession Predictor Recession: 2020 Likelihood Rising 2 Year to 10 Year 0.18%
Inland Empire Population Greater Than 25 of 50 States
Population Forecast, 2018-2045 2045: 6,119,497 1,111,783
Median Household Income, 2017Deducting Housing Costs Above IE
Inland Empire’s Powerful Job Growth! Percent 2018e above 2007 I.E. CA US 15.8% v. 11.0% v. 8.6% Confession Forecast: 45,000 jobs 3.1% 4.7% Unemployment Actual: 46,110 Jobs 3.1% 4.2% Unemployment
Job Growth by Region 2nd Largest 2018 Absolute Job Gain in So. CA!
Unemployment Rates 3.9% 3.5%
Poverty Falling With Job Creation 23.5% 16.4%
Educational Challenge 46.3% 29.2%
$ Payroll Spent $ Payroll Spent Moon Mining Corp. $ Payroll Paid
Health Care Job Growth Strongest High Paying Sector 2011-2018 9.6% of Job Growth
Median Health Care Pay: 2018 $62,363
ACA Impact Health Care Demand & Quality of Life -60% Drop in Uninsured
Residents Per Health Care Worker +26.0% More People 33.5 26.6 Sources: Department of Finance, Demographic Research Unit; CA Employment Development Department
2018 Forecast: ACA Unknowns 2018e 1,800 2019 Prospect: Slightly Stronger
Logistics Job Growth Without Logistics growth, IE would still be in Recession 2011-2018 23.6% of Job Growth
Median Logistics Pay: 2018 $47,946
Skill Ladders Based on Education for PositionMedian Pay Warehousing, Inland Empire 2018
E-Commerce 14.5%
Net Industrial Absorption 20.2 million
Industrial Lease Rates Up 29.0%
ONT Airport Cargo Record Volume 16.1%
2018 Forecast: Space v. Regulators 2018e 11,400 2019 Prospect: Somewhat Weaker
Manufacturing Job Growth 2011-2018 4.0% of Job Growth
2018 Median Manufacturing Pay $54,800
CA Electrical Cost +74.6% +83.5% +135.4%
2018 Forecast: Tariffs & CA Policy 2018e 700 2019 Prospect: Weaker
Construction Job Growth 2011-2018 12.4% Of Job Growth
Median Construction Pay: 2018 Best Paying Blue Collar Sector $53,322
Home Prices FHA Conforming Loan Limit: $431,250 LA/OC is $726,525 +3.7% -10.2%
Price Competition Highest Price Gaps In History
Apartment Rates/Vacancy, 2018 Inland Empire $1,487 3.8% San Diego $1,978 3.9% Ventura $1,983 3.9% Orange $2,035 4.1% Los Angeles $2,267 4.0% Source: USC Lusk Center For Real Estate
2018 Forecast: Supply v. Demand 2018e 4,900 2019 Prospect: A Little Weaker