Genetic Connectivity and Highway Planning Analysis
This analysis involves measuring mountain top distances, predicting inter-breeding levels, drawing genetic connectivity arrows, comparing results, and planning highway routes based on genetic data. It explores relationships between populations and infrastructure planning.


Genetic Connectivity and Highway Planning Analysis
E N D
Presentation Transcript
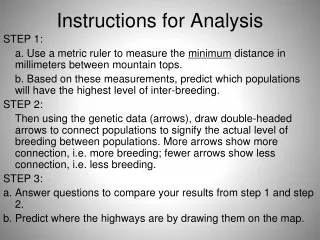
Instructions for Analysis STEP 1: a. Use a metric ruler to measure the minimum distance in millimeters between mountain tops. b. Based on these measurements, predict which populations will have the highest level of inter-breeding. STEP 2: Then using the genetic data (arrows), draw double-headed arrows to connect populations to signify the actual level of breeding between populations. More arrows show more connection, i.e. more breeding; fewer arrows show less connection, i.e. less breeding. STEP 3: a. Answer questions to compare your results from step 1 and step 2. b. Predict where the highways are by drawing them on the map.
STEP 1: • Use a metric ruler to measure the minimum distance in millimeters between mountain tops. • Based on these measurements, predict which populations will have the highest level of inter-breeding.
STEP 2: Using the genetic data (arrows), draw double-headed arrows to connect populations to signify the actual level of breeding between populations. More arrows show more connection, i.e. more breeding; fewer arrows show less connection, i.e. less breeding.
STEP 2: Using the genetic data (arrows), draw double-headed arrows to connect populations to signify the actual level of breeding between populations. More arrows show more connection, i.e. more breeding; fewer arrows show less connection, i.e. less breeding.
STEP 3: • Answer questions to compare your results from step 1 and step 2. • Predict where the highways are by drawing them on the map. Where would you put the highway?
STEP 3: • Answer questions to compare your results from step 1 and step 2. • Predict where the highways are by drawing them on the map.
After completing your analysis, transfer your data onto this overview map. Draw lines that signify the genetic data and draw highways based upon those line data.