Download
1 / 18
180 likes | 280 Vues
Learn about normal distribution, z-scores, and properties of the normal curve. Practice calculating z-scores and identifying data distribution characteristics.

E N D
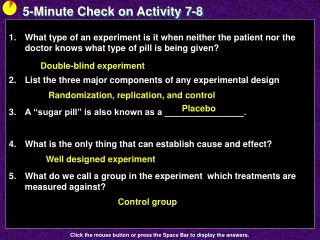
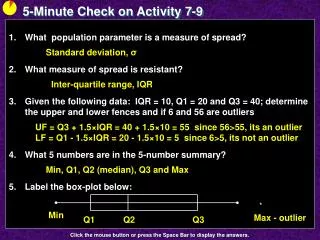
5-Minute Check on Activity 7-9 • What population parameter is a measure of spread? • What measure of spread is resistant? • Given the following data: IQR = 10, Q1 = 20 and Q3 = 40; determine the upper and lower fences and if 6 and 56 are outliers • What 5 numbers are in the 5-number summary? • Label the box-plot below: Standard deviation, σ Inter-quartile range, IQR UF = Q3 + 1.5×IQR = 40 + 1.5×10 = 55 since 56>55, its an outlier LF = Q1 - 1.5×IQR = 20 - 1.5×10 = 5 since 6>5, its not an outlier Min, Q1, Q2 (median), Q3 and Max * Min Max - outlier Q1 Q2 Q3 Click the mouse button or press the Space Bar to display the answers.
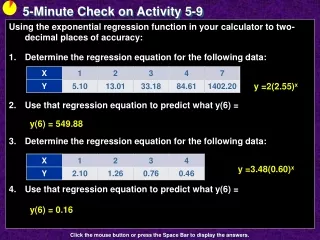
Activity 7 - 10 What Is Normal?
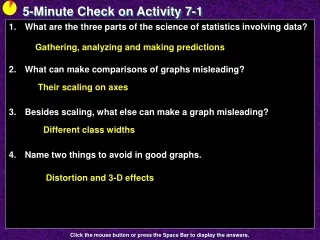
Objectives • Identify a normal distribution • List the properties of a normal curve • Determine the z-score of a given numerical data value in a normal distribution • Identify the properties of a standard normal curve • Solve problems using z-scores of a standardized normal curve
Vocabulary • Normal Distribution – an important distribution in the study of probability and statistics • Normal Curve – is a bell-shaped curve with specific properties • z-scores – a standardized score based on how many standard deviations a data point is away from the mean
Activity The following collection of data gives the heights, in inches, of 35 randomly selected 11th grade male students. The measurements were made to the nearest inch. Type them into L1 in your calculator and it can help you with parts b and d. a) Complete the following frequency distribution table
Activity • Construct a histogram from the frequency distribution in part a • Does the distribution appear to be skewed or symmetric? Explain Symmetric with a little right skewness (towards tail)
Activity cont The following collection of data gives the heights, in inches, of 35 randomly selected 11th grade male students. The measurements were made to the nearest inch. • Determine the mean, median and mode of the given data set. Do your results verify your conclusion in part c? Mean: 68.8 Median: 68 Mode: 68 Yes, symmetric mean, median and mode about the same. Right skewness pulls mean towards it (mean > median)
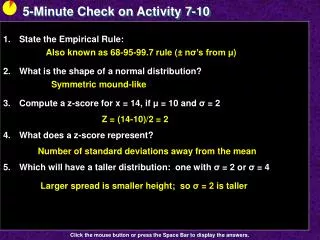
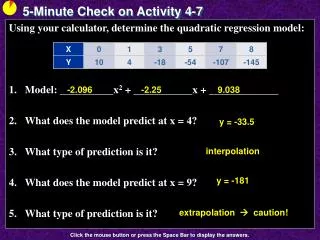
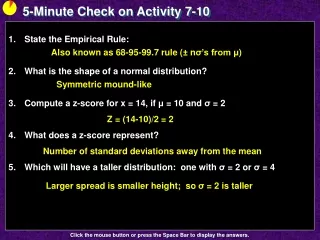
Properties of the Normal Density Curve • The curve is bell-shaped with the highest point at μ, its mean • It is symmetric about a vertical line x = μ, its mean • The mean, median, and mode are all equal • 50% of the data values lie to the right of mean μ; and 50% of the data values lie to the left of the mean μ • The normal curve approaches the horizontal axis, but never touches or crosses the axis • The Empirical Rule applies: • 68% of the data lies within 1 standard deviation of the mean • 95% of the data lies within 2 standard deviations of the mean • 99.7% of the data lies within 3 standard deviations of the mean
Normal Curves • Two normal curves with different means (but the same standard deviation) [on left] • The curves are shifted left and right • Two normal curves with different standard deviations (but the same mean) [on right] • The curves are shifted up and down
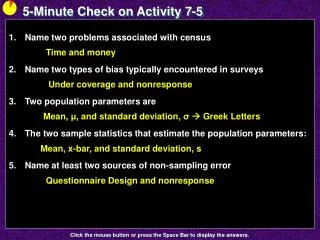
Empirical Rule μ ± 3σ μ ± 2σ • Also known in statistics as the 68-95-99.7 Rule μ ± σ 99.7% 95% 68% 2.35% 2.35% 34% 34% 0.15% 13.5% 13.5% 0.15% μ μ - 2σ μ + 2σ μ - 3σ μ - σ μ + σ μ + 3σ
Activity cont e) Is this distribution Normal? Approximately normal. With slight right-skewness is not exactly normal.
Normal Probability Density Function • There is a y = f(x) style function that describes the normal curve:where μ is the mean and σ is the standard deviation of the random variable x • Only used in college post-calculus statistics 1 y = -------- e √2π -(x – μ)2 2σ2
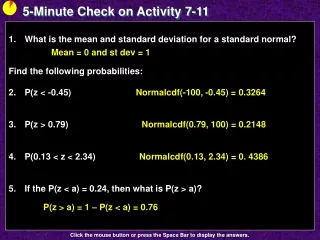
Standardized Score • Z-score: The number of standard deviations a value is away from its meanwhere x is the data valueμ is the mean of the data set is the standard deviation of the data • Values below the mean will be negative and values above the mean will be positive • Normal distributions can be written as N(,) x - μ z = --------
Example 1 A random variable x is normally distributed with μ=10 and σ=3. • Compute Z for x1 = 8 • Compute Z for x2 = 12 • Compute Z for x3 = 10 8 – 10 -2 Z = ---------- = ----- = -0.67 3 3 12 – 10 2 Z = ----------- = ----- = 0.67 3 3 10 – 10 0 Z = ----------- = ----- = 0.00 3 3
Example 2 The heights of 16-year old males are normally distributed as N(68,2) • Compute Z for 71 inches • Compute Z for 64 inches • Compute Z for 62 inches 71 – 68 3 Z = ---------- = ----- = 1.50 2 2 64 – 68 4 Z = ----------- = ----- = -2.00 2 2 62 – 68 -6 Z = ----------- = ----- = -3.00 2 2
Example 3 A random variable x is normally distributed with μ=10 and σ=3. Given the z-scores, find the original value. • Find x for z = 2 • Find x for z = -1 • Find x for z = -0.5 x – 10 2 = ---------- 6 = x – 10 16 = x 3 x – 10 -1 = ----------- -3 = x – 10 7 = x 3 x – 10 -0.5 = ----------- -1.5 = x – 10 8.5 = x 3
Example 4 What do the following z-scores mean? • z = -1 • z = 2 • z = 0 data point is one standard deviation below the mean data point is two standard deviations above the mean data point is at the mean
Summary and Homework • Summary • Normal curves are bell-shaped and symmetric about its mean (which is equal to mode and median) • Mean, , has 50% of data above it and below it • Empirical Rule: 68-95-99.7% of the data lies within plus or minus 1-2-3 standard deviations of the mean • Standard normal curve has = 0 and = 1 • Z-scores are a measure of standard deviations • Base on standard normal curve • Positive values above mean; negative values below mean • Homework • pg 871 – 873; problems 1- 5