Download

1 / 31
310 likes | 404 Vues
Learn about experimental designs, including double-blind experiments and control groups, and measures of variability like standard deviation and quartiles in this informative lesson.

E N D
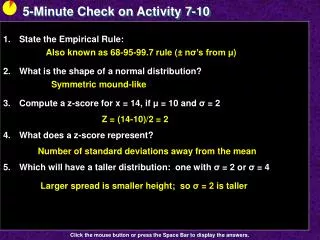
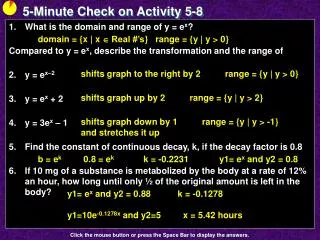
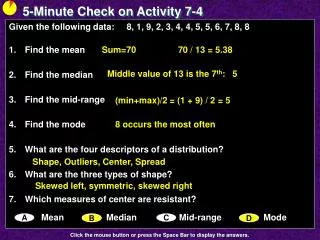
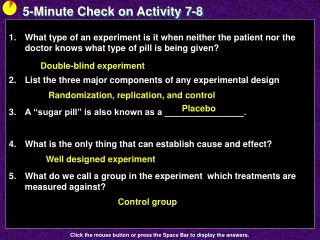
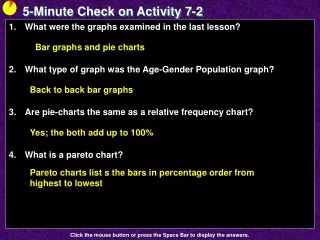
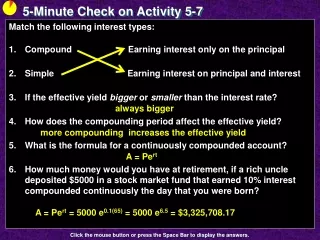
5-Minute Check on Activity 7-8 • What type of an experiment is it when neither the patient nor the doctor knows what type of pill is being given? • List the three major components of any experimental design • A “sugar pill” is also known as a ________________. • What is the only thing that can establish cause and effect? • What do we call a group in the experiment which treatments are measured against? Double-blind experiment Randomization, replication, and control Placebo Well designed experiment Control group Click the mouse button or press the Space Bar to display the answers.
Submarine interior (unspecified class) at the Royal Naval Museum, Copenhagen, Denmark Activity 7 - 9 A Switch Decision
Objectives • Measure the variability of a frequency distribution
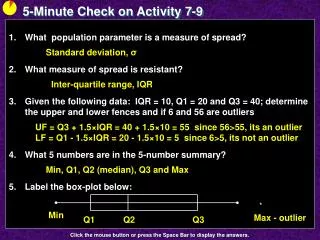
Vocabulary • Standard Deviation – measures how much the data deviates from the mean • Boxplot – statistical graph that helps visualize the variability of a distribution • Five-number Summary– the min, quartile 1, 2 and 3 and the max of the data set
Activity The following sets of data are the result of testing two different switches that can be used in the life-support system on a submarine. Two hundred of each type of switch were placed under continuous stress until they failed, the recorded in hours. Switch A and B have approximately the same means and medians, as displayed by the following histograms.
Activity cont 1. What does the means and medians being the same tell us about the distributions? Distributions are symmetric
Activity cont 2. Which distribution is most spread out? Switch B is more spread out
Activity cont 3. Which distribution is packed more closely together around its center?) Switch A is tighter
Activity cont 4. Which of these two switches would you choose and why? Switch A because is varies less
Activity cont 5. Determine the range of the two switches: Switch A: 87.52 – 76.68 = 10.84 Switch B: 94.03 – 65.87 = 28.16
Activity cont 6. Determine the IQR (interquartile range), which is Q3 – Q1 for each switch Switch A: 83.47 – 80.53 = 2.94 Switch B: 85.45 – 78.99 = 6.46
Activity cont 7. Write down sx for each switch (this is something we will call the standard deviation) Switch A: 2.03 Switch B: 5.00
Measures of Spread • Variability is the key to Statistics. Without variability, there would be no need for the subject. • When describing data, never rely on center alone. • Measures of Spread: • Range - {rarely used ... why?} • Quartiles - InterQuartile Range {IQR=Q3-Q1} • Variance and Standard Deviation {var and sx} • Like Measures of Center, you must choose the most appropriate measure of spread.
Standard Deviation • Another common measure of spread is the Standard Deviation: a measure of the “average” deviation of all observations from the mean. • To calculate Standard Deviation: • Calculate the mean. • Determine each observation’s deviation (x - xbar). • “Average” the squared-deviations by dividing the total squared deviation by (n-1). • This quantity is the Variance. • Square root the result to determine the Standard Deviation.
Standard Deviation Properties • s measures spread about the mean and should be used only when the mean is used as the measure of center • s = 0 only when there is no spread/variability. This happens only when all observations have the same value. Otherwise, s > 0. As the observations become more spread out about their mean, s gets larger • s, like the mean x-bar, is not resistant. A few outliers can make s very large
Standard Deviation • Variance: • Standard Deviation: • Example 1.16 (p.85 of YMS): Metabolic Rates
Standard Deviation Metabolic Rates: mean=1600 What does this value, s, mean?
Example 1 Which of the following measures of spread are resistant? • Range • Variance • Standard Deviation Not Resistant Not Resistant Not Resistant
Standard Deviation Using the TI-83 • Enter the test data into List, L1 • STAT, EDIT enter data into L1 • Calculate Standard Deviation • Hit STAT go over to CALC and select 1-Var Stats and hit 2nd 1 (L1) • Read sx to get standard deviation • Square sx to get variance • x is population standard deviation (and won’t be used by AFDA) • Don’t worry about the formula we just went over
Example 2 Given the following set of data:What is the range?What is the standard deviation?What is the variance? 32 - 19 = 13 3.751 (3.751)2 = 14.070
Q1=23 med Q3=29.5 Q1 Q3 med=79 Quartiles • Quartiles Q1 and Q3 represent the 25th and 75th percentiles. • To find them, order data from min to max. • Determine the median - average if necessary. • The first quartile is the middle of the ‘bottom half’. • The third quartile is the middle of the ‘top half’.
45 50 55 60 65 70 75 80 85 90 95 100 Quiz Scores Outlier? 5-Number Summary, Boxplots • The 5 Number Summary provides a reasonably complete description of the center and spread of distribution • We can visualize the 5 Number Summary with a boxplot.
Box Plots Using the TI-83 • Enter the test data into List, L1 • STAT, EDIT enter data into L1 • Calculate 5 Number Summary • Hit STAT go over to CALC and select 1-Var Stats and hit 2nd 1 (L1) • Use 2nd Y= (STAT PLOT) to graph the box plot • Turn plot1 ON • Select BOX PLOT (4th option, first in second row) • Xlist: L1 • Freq: 1 • Hit ZOOM 9:ZoomStat to graph the box plot • Copy graph with appropriate labels and titles
Determining Outliers “1.5 • IQR Rule” • InterQuartile Range “IQR”: Distance between Q1 and Q3. Resistant measure of spread...only measures middle 50% of data. • IQR = Q3 - Q1 {width of the “box” in a boxplot} • 1.5 IQR Rule: If an observation falls more than 1.5 IQRs above Q3 or below Q1, it is an outlier. Why 1.5? According to John Tukey, 1 IQR seemed like too little and 2 IQRs seemed like too much...
Outliers: 1.5 • IQR Rule To determine outliers: • Find 5 Number Summary • Determine IQR (Q3 – Q1) • Multiply 1.5xIQR • Set up “fences” • Lower Fence: Q1-(1.5∙IQR) • Upper Fence: Q3+(1.5∙IQR) • Observations “outside” the fences are outliers.
fence: 19.06-39.99 = -20.93 outliers fence: 45.72+39.99 = 85.71 0 10 20 30 40 50 60 70 80 90 100 Spending ($) IQR=45.72-19.06 IQR=26.66 { } Outlier Example 1.5IQR=1.5(26.66) 1.5IQR=39.99
Example 3 Consumer Reports did a study of ice cream bars (sigh, only vanilla flavored) in their August 1989 issue. Twenty-seven bars having a taste-test rating of at least “fair” were listed, and calories per bar was included. Calories vary quite a bit partly because bars are not of uniform size. Just how many calories should an ice cream bar contain? Construct a boxplot for the data above.
Example 3 - Answer Q1 = 182 Q2 = 221.5 Q3 = 319 Min = 111 Max = 439 Range = 328 IQR = 137 UF = 524.5 LF = -23.5 100 125 150 175 200 225 250 275 300 325 350 375 400 425 450 475 500 Calories
Example 4 The weights of 20 randomly selected juniors at MSHS are recorded below: a) Construct a boxplot of the data b) Determine if there are any outliers c) Comment on the distribution
Example 4 - Answer Q1 = 130.5 Q2 = 138 Q3 = 145.5 Min = 121 Max = 213 Range = 92 IQR = 15 UF = 168 LF = 108 Mean = 143.6 StDev = 23.91 Extreme Outliers( > 3 IQR from Q3) * * 100 110 120 130 140 150 160 170 180 190 200 210 220 Weight (lbs) Shape: somewhat symmetric Outliers: 2 extreme outliers Center: Median = 138 Spread: IQR = 15
Summary and Homework • Summary • Variability of a frequency distribution refers to how spread out the data is, away from center • Range is the max – the min of the data • Deviation of a data value is how far away from the mean it is • Standard deviation is a measure of how spread out all of the data is • Boxplot is a graph of the 5-number summary • Homework • pg 861 – 863; problems 1, 4, 6, 7